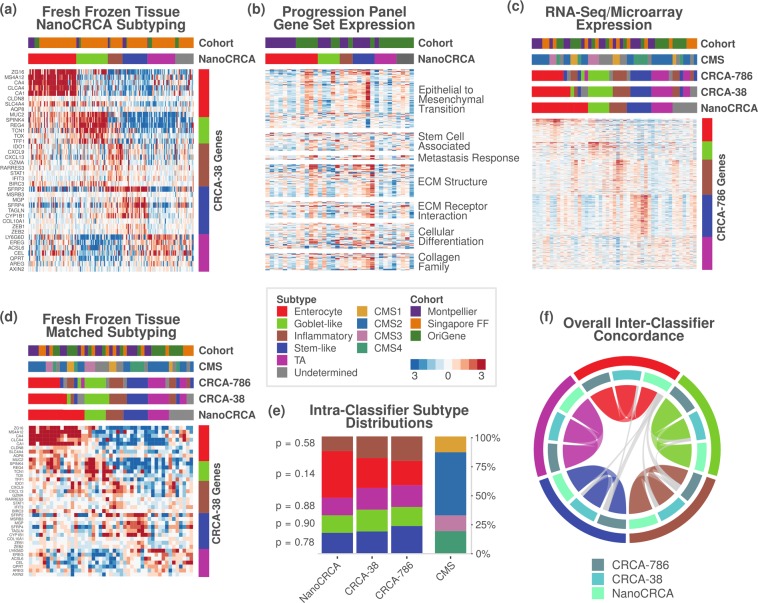
Figure 4.
NanoCRCA subtyping, pathway and 786-gene signature analysis with subtype stability. (a) Heatmap showing the expression of the 38-gene-panel as measured using the NanoCRCA assay in the three fresh frozen cohorts (n = 179). From top to bottom, the upper bars indicate the cohort and the NanoCRCA subtypes as determined by nCounter profiles. The right-hand vertical bar indicates the subtype association of each gene. (b) Heatmap of nCounter PanCancer Progression Panel-based gene expression profiles from the Montpellier and OriGene cohorts of samples (n = 34). Upper bars are as in a). Genes are grouped according to functional annotations provided by NanoString Technologies. (c,d) Heatmap of c) RNAseq/microarray gene expression profiles and d) NanoCRCA gene expression profiles from samples from all the three cohorts having matched data (n = 47). From top to bottom, the upper bars indicate the cohort, the CMS subtype, the CRCA-786 and CRCA-38 subtypes as determined by microarray/RNAseq profiles, and the NanoCRCA subtypes as determined by nCounter profiles. The right-hand vertical bar indicates the subtype association of each gene. (e) Distribution of subtypes according to each classifier. Samples that were of undetermined subtype were excluded for each classifier (NanoCRCA n = 40; CRCA-38 n = 43; CRCA-786 n = 43; CMS n = 37). P-values resulting from statistical tests of proportion for each subtype between the three CRCA classifiers are shown on the left-hand side. (f) Chord plot illustrating the tendency of samples to be classified as the same subtype between the three assays. Samples from all three cohorts which had no undetermined subtype calls were included (n = 34). Each arc connects the classification of a sample in two different assays, and each sample is represented by three arcs (connecting NanoCRCA, CRCA-38 and CRCA-786 subtypes). Samples with the same subtype in all three assays are coloured by that subtype. Samples that had discordant classification between the assays are coloured grey (4/34 samples).

