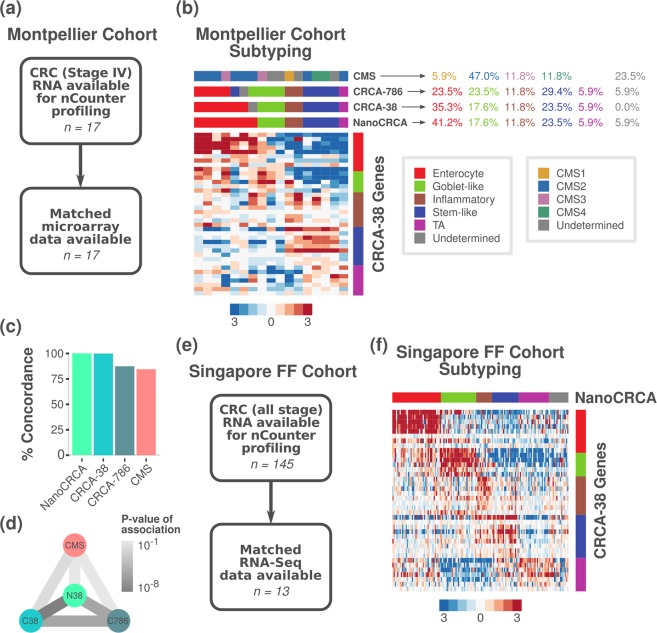
Figure 5.
Montpellier cohort: NanoCRCA assay, its comparison with other platforms and the CMS classifier; and Singapore FF cohort: NanoCRCA assay. (a) A summary of the Montpellier cohort showing patient characteristics, sample size and available microarray data. (b) Heatmap showing the expression of the 38-gene-panel in the Montpellier cohort as measured using NanoCRCA assay (n = 17). From top to bottom, the upper bars indicate the CMS, CRCA-786 and CRCA-38 subtypes as determined by microarray profiles, and the NanoCRCA subtypes as determined by nCounter profiles. The right-hand vertical bar indicates the subtype association of each gene. The percentage of samples falling into each CMS and CRCA subtype is shown on the right. (c,d) Comparisons between NanoCRCA and microarray-based classifications CRCA-38, CRCA-786 and CMS showing c) percent concordance to NanoCRCA and d) statistical significance (Fisher’s exact test) in the Montpellier cohort. (e) A summary of the Singapore FF cohort showing patient characteristics and sample size. (f) Heatmap showing the expression of the 38-gene panel in the Singapore FF cohort as measured using NanoCRCA assay (n = 145). The subtypes as assigned using the NanoCRCA assay are shown on the top bar. The right-hand vertical bar indicates the subtype association of each gene. Subtype colours are as in b).

