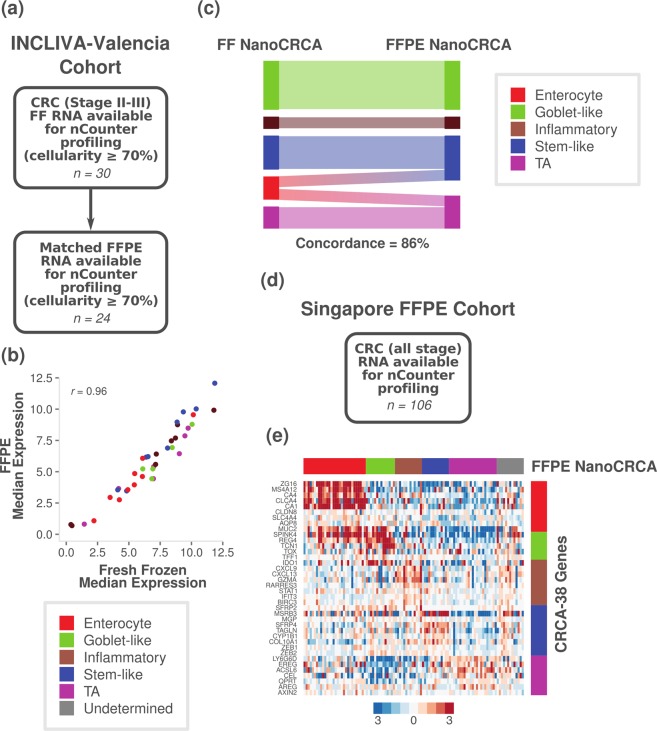
Figure 6.
Translation of assay via matched fresh frozen and FFPE tissue. (a) A summary of the INCLIVA-Valencia cohort, showing patient characteristics and sample size. (b) A scatter plot showing median expression of the 38 genes in samples with tumour cellularity ≥70% in both fresh frozen and FFPE tissues (n = 24). Colours indicated each gene’s association with the subtypes. (c) Alluvial diagram showing the subtype classification of matched fresh frozen and FFPE tissues for cellularity-selected samples (excluding undetermined samples; n = 14). (d) A summary of the Singapore FFPE cohort, showing patient characteristics and sample size. (e) A heatmap showing the expression of the 38-gene panel in Singapore FFPE samples as measured using the NanoCRCA assay (n = 106). The subtypes as assigned using the NanoCRCA assay are shown on the top bar. The right-hand vertical bar indicates the subtype association of each gene. Subtype colours are as in b).

