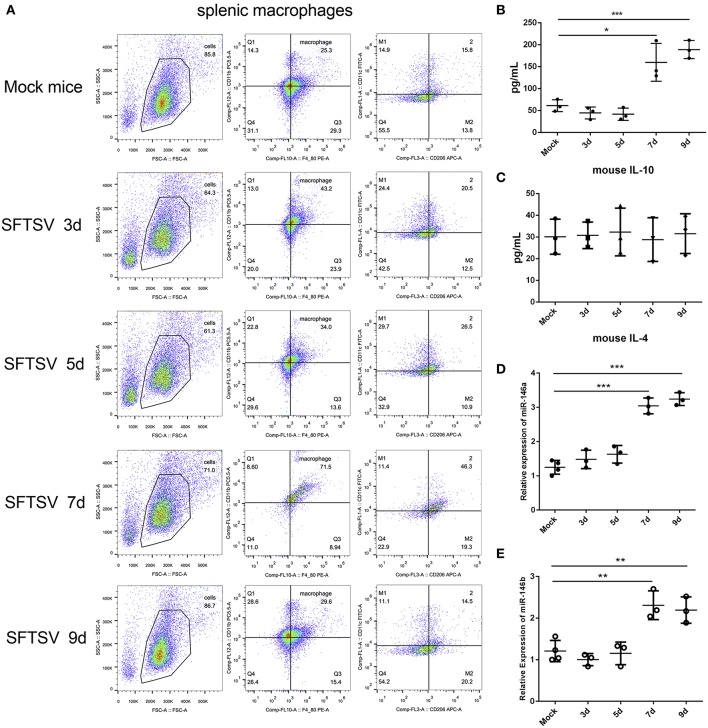
Figure 7.
SFTSV induced macrophage differentiation in vivo. (A). Flow-cytometry profiling of mouse splenic macrophages subsets after SFTSV infection. Macrophages were gated CD11b+ and F4/80+, M1 macrophages were gated CD11c+, and M2 macrophages were gated CD206+. (B,C) The expression level of IL-10 (B) and IL-4 (C) were determined by ELISA in mouse serum that infected with SFTSV. (D,E)The expression of miR-146a (D) and miR-146b (E) within sorted mouse splenic macrophages in each group (n = 3). Data in all panels are shown as mean ± SEM (*P < 0.05, **P < 0.01, ***P < 0.001).

