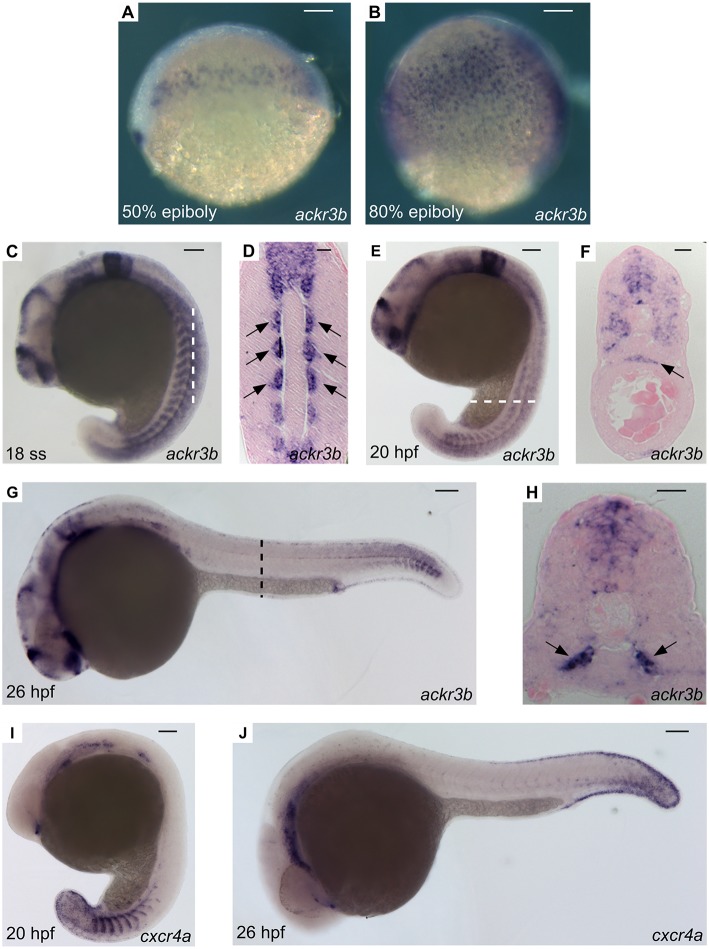
Figure 2.
WISH analysis of ackr3b and cxcr4a expression during zebrafish embryo development. WISH analysis of ackr3b (A–H) and cxcr4a (I–J) mRNA expression was performed at the indicated stages of development. (A–C,E,G,I,J) Lateral view of whole-mount embryos. (D) Coronal cross section through the trunk highlighted as a dashed vertical bar in (C), anterior to the top; arrows indicate somitic ackr3b expression. (F,H) Transverse cross sections through the trunk highlighted as dashed bars in (E,G), respectively. Arrows in (F,H) indicate ackr3b-positive developing gut and the basal part of the somites, respectively. (A–C,E,G,I,J) Scale bar: 100 μm. (D,F,H) Scale bar: 25 μm.

