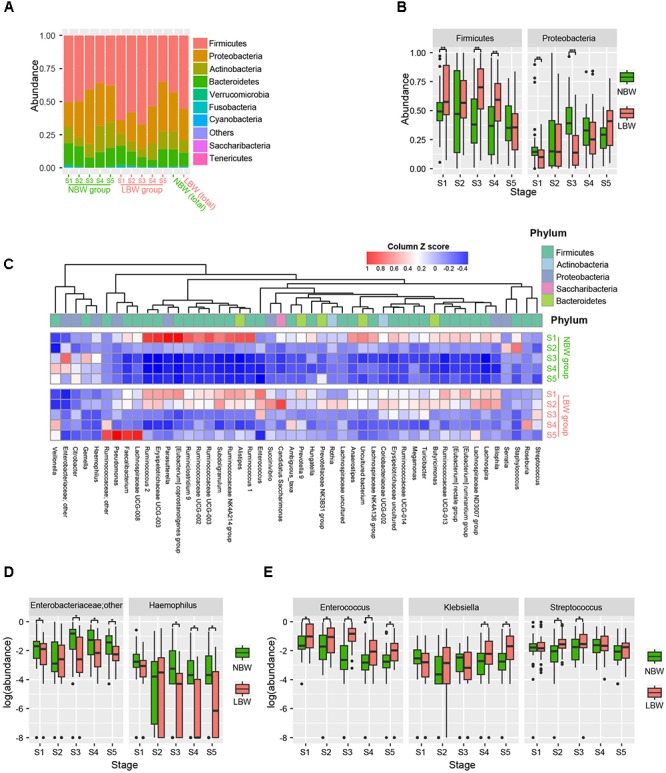
FIGURE 3.

Phyla and genera strikingly different between the LBW and NBW groups. Phylum level gut microbial relative abundance at all stages (A). Relative abundance of gut microbiota at phylum level, including Firmicutes and Proteobacteria (B). Differentiated genera between LBW and NBW groups were displayed by using heatmap according to different stages and groups (adjust P < 0.01, Wilcoxon rank sum test corrected for multiple testing by the Benjamini and Hochberg method), and the abundance profiles are transformed into Z-scores by subtracting the average abundance and dividing the standard deviation of all samples (C). Relative abundance of gut microbial taxa at genus level, including an unknown Enterobacteriaceae genus and Haemophilus enriched in NBW group (D), and Enterococcus, Klebsiella, Streptococcus enriched in LBW group (E). LBW, low birth weight; NBW, normal birth weight. ∗P < 0.05, ∗∗P < 0.01, ∗∗∗P < 0.001.
