
FIGURE 8.
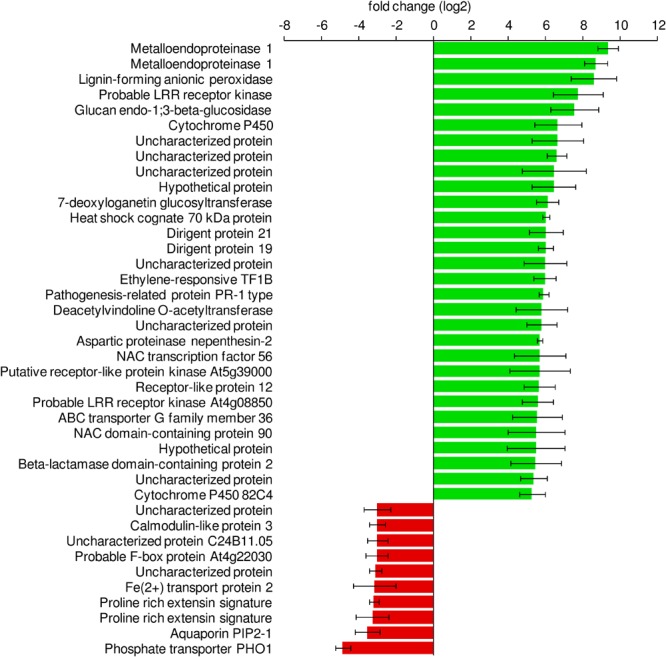
Differentially expressed lettuce genes in response to S. Typhimurium 14028s. Sterile lettuce plants were exposed to S. Typhimurium 14028s or 10 mM MgCl2 for 24 h. The 30 genes with the highest increase in fold change and the 10 with the highest decrease in fold change are shown. Standard errors are indicated by error bars (p < 0.05, n = 3).