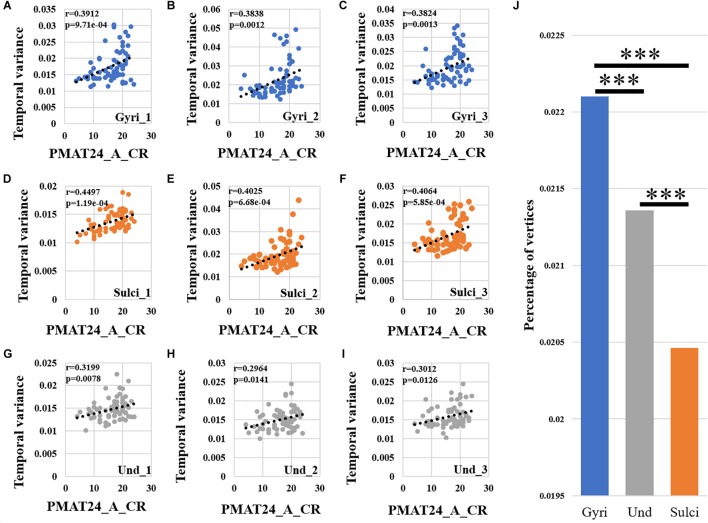
FIGURE 5.
Correlation between temporal variability of functional activity and fluid intelligence measure “number of correct responses” (PMAT24_A_CR) across all brain regions. (A–C) The correlations between temporal variance and “number of correct responses” measure across all 68 subjects of three example gyral vertices, respectively. (D–F) The correlations between temporal variance and “number of correct responses” measure across all 68 subjects of three example sulcal vertices, respectively. (G–I) The correlations between temporal variance and “number of correct responses” measure across all 68 subjects of three example undefined vertices, respectively. (J) The mean percentage of gyral/sulcal/undefined vertices with significant positive correlations with the “number of correct responses” measure across all 68 subjects. ∗∗∗Indicates p < 0.001.

