FIGURE 8.
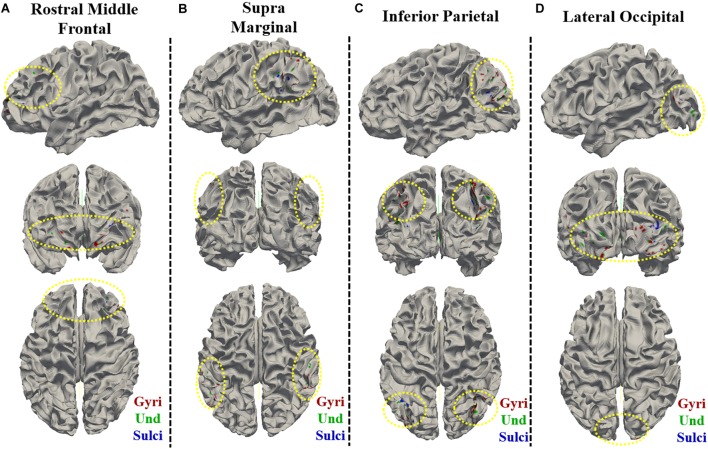
Visualization of the vertices with significant positive correlation between temporal variance and the “number of correct responses” measure within single brain region on cortical surface of one subject. The vertices distribution on cortical surface are shown from three views within (A) Rostral Middle Frontal, (B) SupraMarginal, (C) Inferior Parietal, and (D) Lateral Occipital regions, respectively. The main locations of those vertices on cortical surface are highlighted by yellow dashed ovals.

