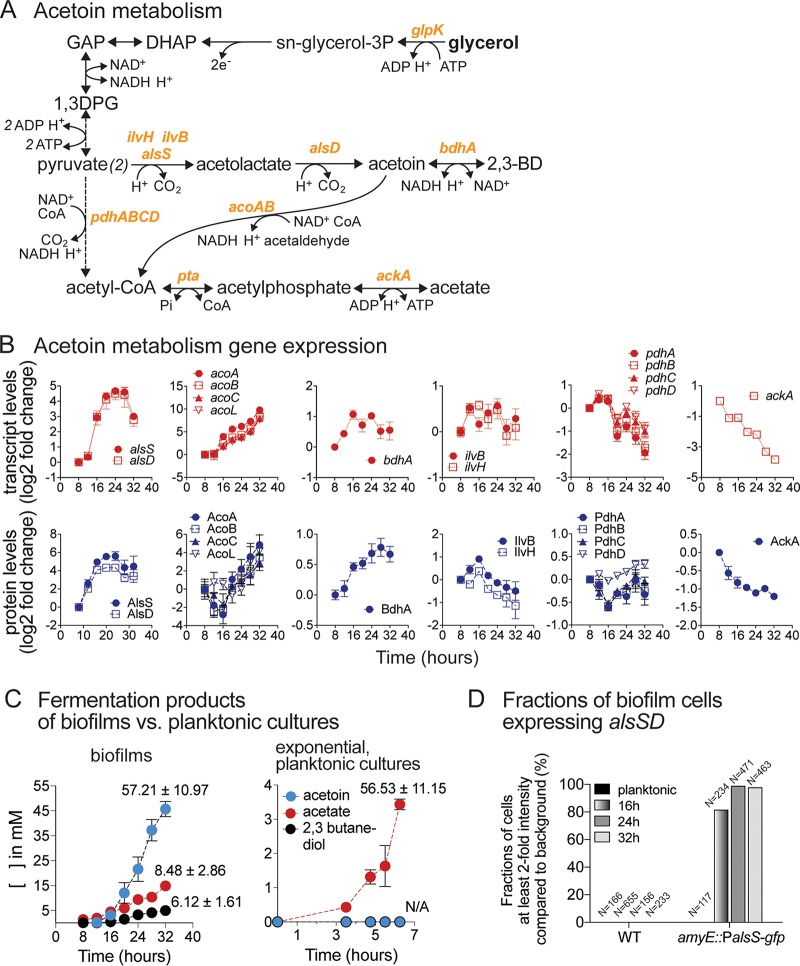
FIG 11.
Upregulation of acetoin biosynthesis during biofilm development. (A) Acetoin and acetate fermentation pathways. Abbreviations: GAP, glyceraldehyde-3-phosphate; 1,3DPG, 1,3-diphosphoglycerol; 2,3BD, 2,3-butanediol. Enzyme genes are shown in orange text. (B) Transcript and protein levels of acetoin and acetate metabolism genes. Data are displayed as log2 fold changes relative to the initial 8-h time point. Genes within the same operon are shown in the same graph. Data represent averages of results from 4 (transcript) or 3 (protein) biological replicates ± SEM. (C) Production of major fermentation products (acetoin, acetate, and 2,3-butanediol) during biofilm development and in exponential-phase planktonic cultures. Data represent averages of results from 6 biological replicates ± SEM. (D) Fractions of cells actively expressing the alsSD operon. Promoter regions of alsSD were fused with gfp(sf) and integrated at the amyE locus to allow estimation of alsSD expression levels. Cells from planktonic cultures and 16 h, 24 h, and 32 h biofilms were observed under a fluorescence microscope. The GFP intensity of each object (cell) was recorded. The bar graph shows the fractions of cells with at least 2-fold-higher intensity than the background (see also Fig. S8).

