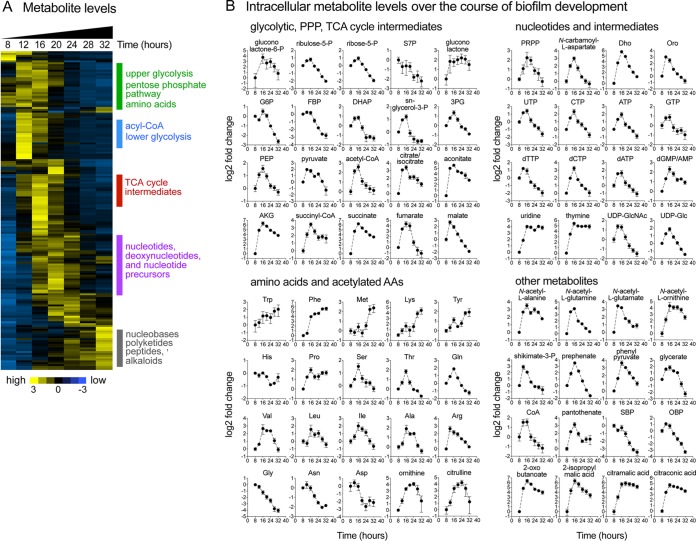
FIG 2.
Dynamic remodeling of B. subtilis metabolome during biofilm development. (A) Samples for LC-MS metabolomic analysis were taken at 8, 12, 16, 20, 24, 28, and 32 h during biofilm development. Metabolite measurements were normalized by cell numbers and are displayed as log2 z-scores. The heat map displays data for 166 metabolites. The yellow (high) and blue (low) color scale indicates relative metabolite abundances across the time course. (B) Intracellular levels of selected metabolites displayed as log2 fold changes relative to the initial 8-h time point. Data represent averages of results from 4 biological replicates ± SEM. Abbreviations: P, phosphate; S7P, sedoheptulose-7-phosphate; G6P, glucose-6-phosphate; FBP, fructose-1,6-bisphosphate; DHAP, dihydroxy-acetone-phosphate; 3PG, 3-phosphoglycerate; PEP, phosphoenolpyruvate; AKG, α-ketoglutarate; Trp, tryptophan; Phe, phenylalanine; Met, methionine; Lys, lysine; Tyr, tyrosine; His, histidine; Pro, proline; Ser, serine; Thr, threonine; Gln, glutamine; Val, valine; Leu, leucine; Ile, isoleucine; Ala, alanine; Arg, arginine; Asn, asparagine; Gly, glycine; Asp, aspartate; PRPP, 5-phosphoribosyl-pyrophosphate; Dho, dihydroorotate; Oro, orotate; GlcNAc, N-acetylglucosamine; Glc, glucose; SBP, sedoheptulose bisphosphate; OBP, octulose bisphosphate.

