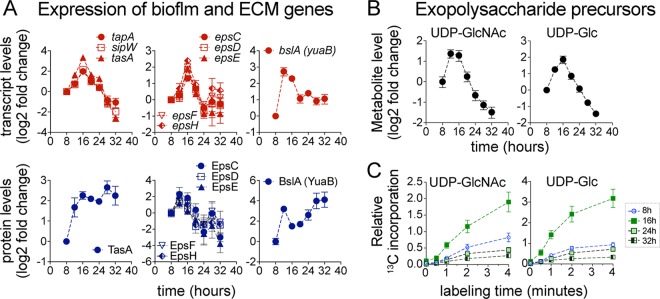
FIG 6.
Upregulation of extracellular matrix (ECM) genes. (A) Transcript and protein levels of ECM genes displayed as log2 fold changes relative to the initial 8-h time point. Error bars represent ± SEM of results from 4 (transcript) and 3 (protein) biological replicates. (B) Intracellular levels of UDP-GlcNAc and UDP-Glc, precursors of exopolysaccharide biosynthesis, displayed as log2 fold changes relative to the initial 8-h time point. Data represent averages of results from 4 biological replicates ± SEM. (C) Relative levels of 13C-carbon incorporation into UDP-GlcNAc and UDP-Glc at 8, 16, 24, and 32 h during biofilm development. Data represent averages of results from 3 biological replicates ± SEM.

