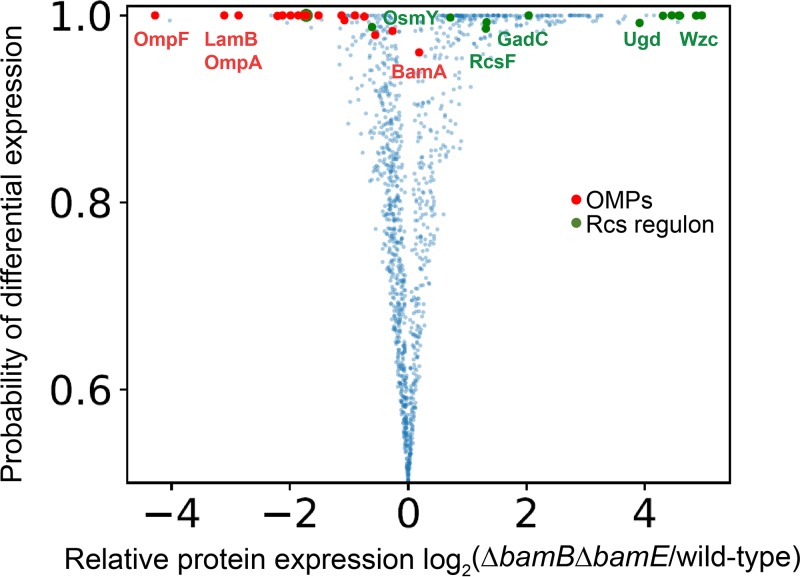
FIG 1.
Quantitative proteomic analysis of ΔbamB ΔbamE mutant. Volcano plot of protein expression comparison between wild-type and ΔbamB ΔbamE cells. Each dot represents a protein. The horizontal axis shows the log2 fold change of protein abundance. The vertical axis represents the likelihood that differential expression is observed between the two conditions (21). Red dots represent β-barrel OMPs, and green dots indicate proteins involved in the Rcs stress regulon that confidently (>0.95) change their respective expression levels. Global levels of β-barrel OMPs are reduced while levels of Rcs regulon members are mostly upregulated in the ΔbamB ΔbamE mutant relative to wild type, with a high degree of confidence.

