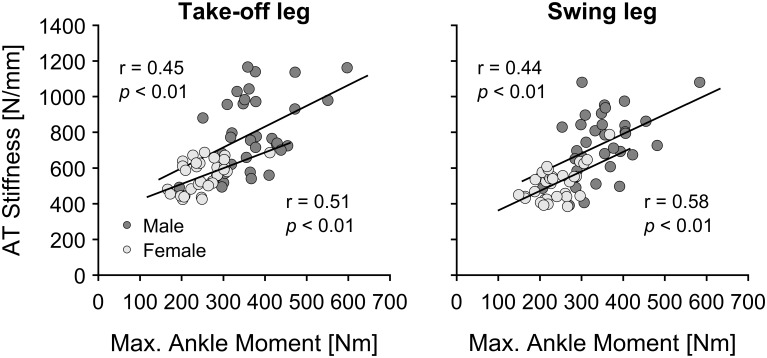
FIGURE 3.
Correlations between maximal ankle plantar flexion moment (Max. Ankle Moment) and Achilles tendon (AT) stiffness in the take-off and swing leg in male (n = 35) and female (n = 32) elite athletes. Correlation coefficients for male elite jumpers (dark gray circles) are shown in the upper left corner and for female elite jumpers (light gray circles) in the lower right corner of the figure.

