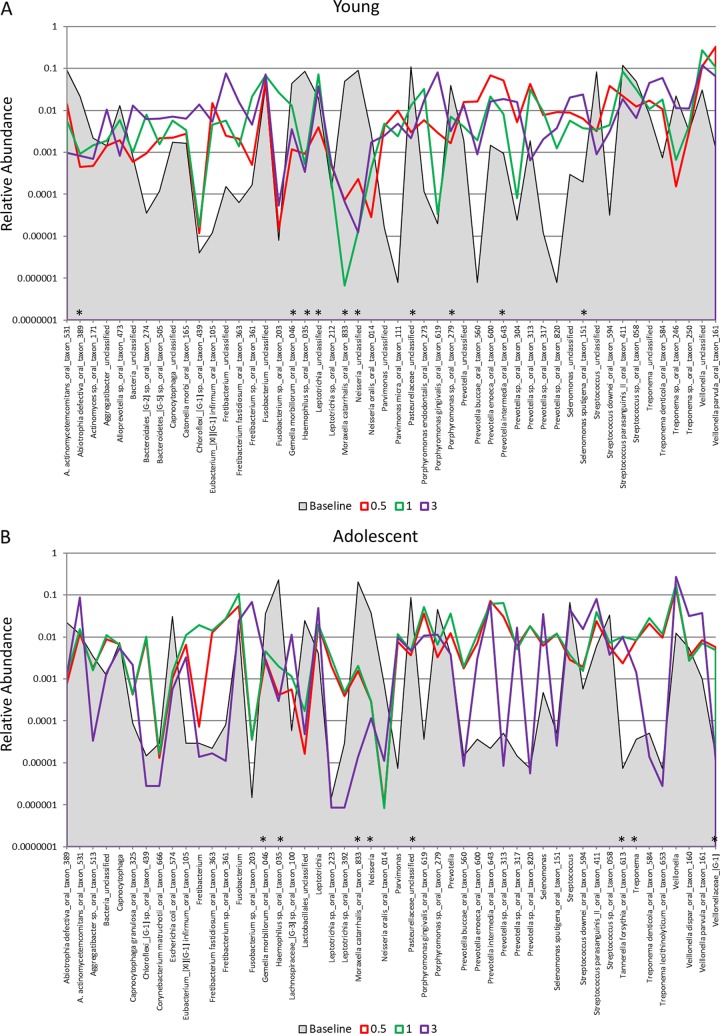
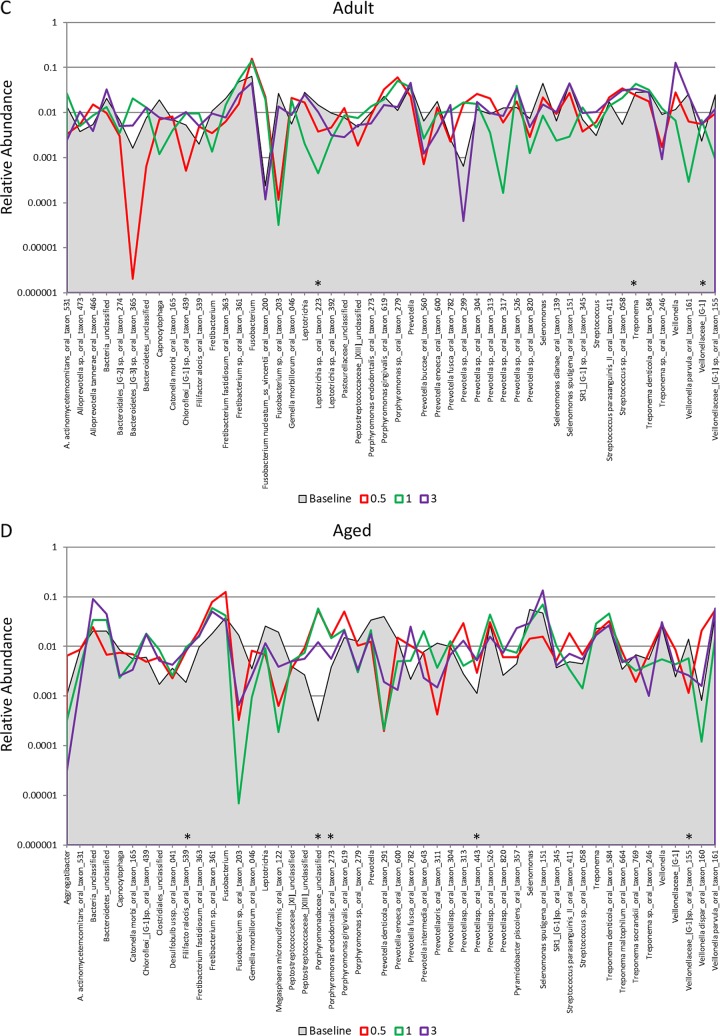
FIG 3.
Distribution and relative abundance of signals for the top 50 OTUs in baseline samples from young (A), adolescent (B), adult (C), and aged (D) animals and readouts for each OTU/species and for samples collected at 2 weeks (0.5 months) and at 1 and 3 months postligation during initiation and progression of disease. The asterisks denote a significant difference from the baseline with disease (0.5, 1, and 3 months) at a P value of at least <0.05 using Z-score normalization.


