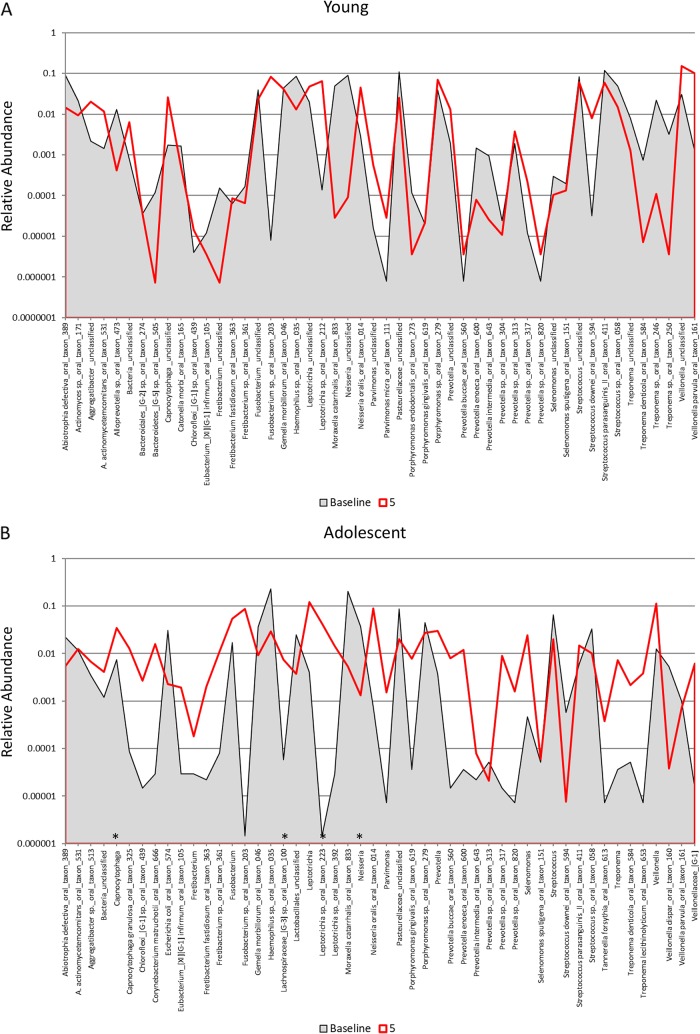
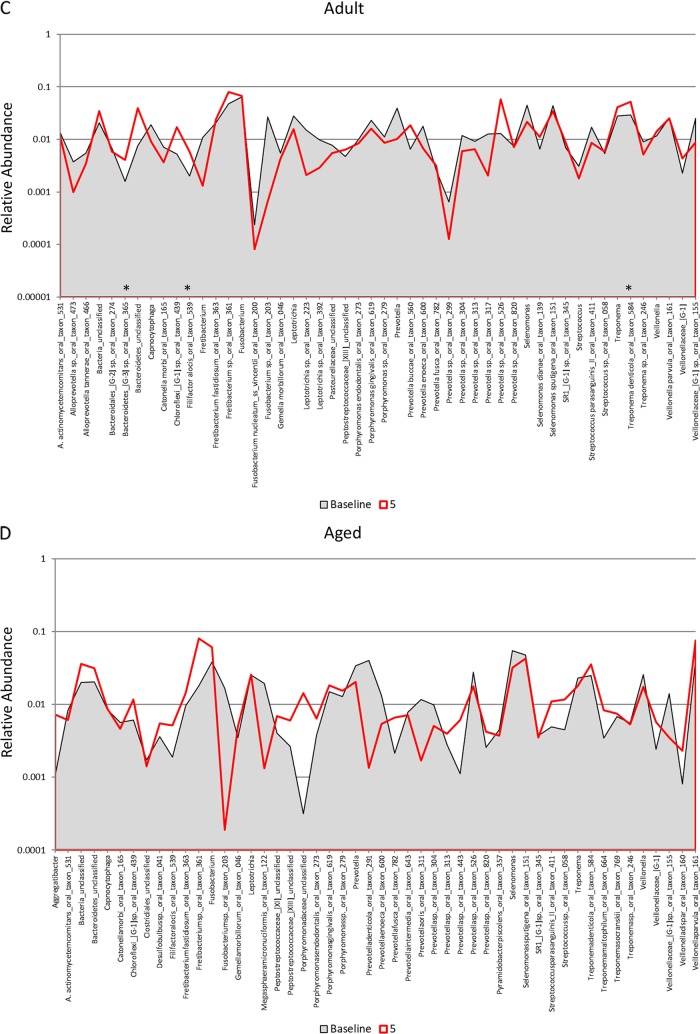
FIG 6.
Distribution and relative abundance of signals for the top 50 OTUs in samples from young (A), adolescent (B), adult (C), and aged (D) animals. The plots compare the readouts for each OTU/species for baseline samples compared to samples collected 5 months and 2 months following removal of the ligatures with clinical resolution. The asterisks denote a significant difference from the baseline with resolution (5 months) at a P value of at least <0.05 using Z-score normalization.


