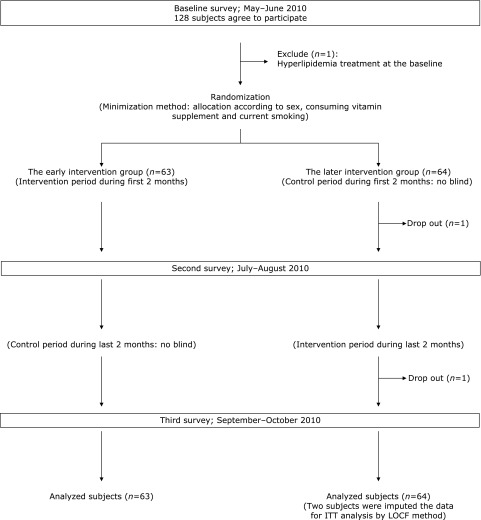
Fig. 1.
Study design and sampling scheme. The figure shows the timeline and sampling scheme, i.e., randomization, the intervention, and control periods for each group, the number of participant dropout and the analysed subjects in each group, and the methods of the intention-to-treat (ITT) analysis.

