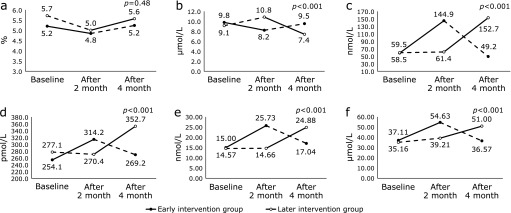
Fig. 2.
Changes in %FMD, plasma homocysteine, and serum vitamin B groups and C levels in the early and later intervention groups. The black circle denotes the early intervention group. The open circle denotes the later intervention group. The straight line denotes the intervention period. The dotted line denotes the non-intervention period for (a) %FMD, (b) plasma homocysteine, (c) serum vitamin B6 (pyridoxal), (d) serum vitamin B12, (e) serum folate, and (f) serum vitamin C levels. P values denote the effect of the intervention.

