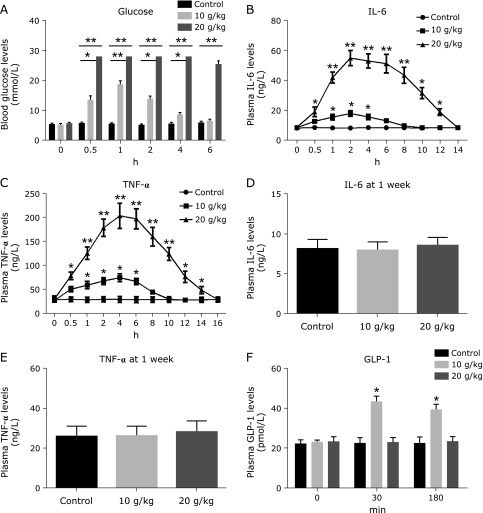
Fig. 2.
The changes of the levels of blood glucose, pro-inflammatory cytokines and GLP-1 following high-glucose load. Wild-type mice (n = 8) were administrated with high-glucose (10 and 20 mg/kg, respectively) or saline 0.9% solution, and blood were collected at different time windows for analyzing blood glucose concentrations at 0–6 h (A), interleukin-6 (IL-6) levels at 0–14 h time point (B), tumor necrosis factor-α (TNF-α) levels at 0–16 h time point (C), and IL-6 (D) and TNF-α levels (F) at 1 week after high glucose administration, as well as GLP-1 levels (F) at 30 and 180 min following high glucose load. Differences between the treatment group and control group are presented in the figures (*p<0.05, **p<0.01). The values are mean ± SEM.

