Fig. 2.

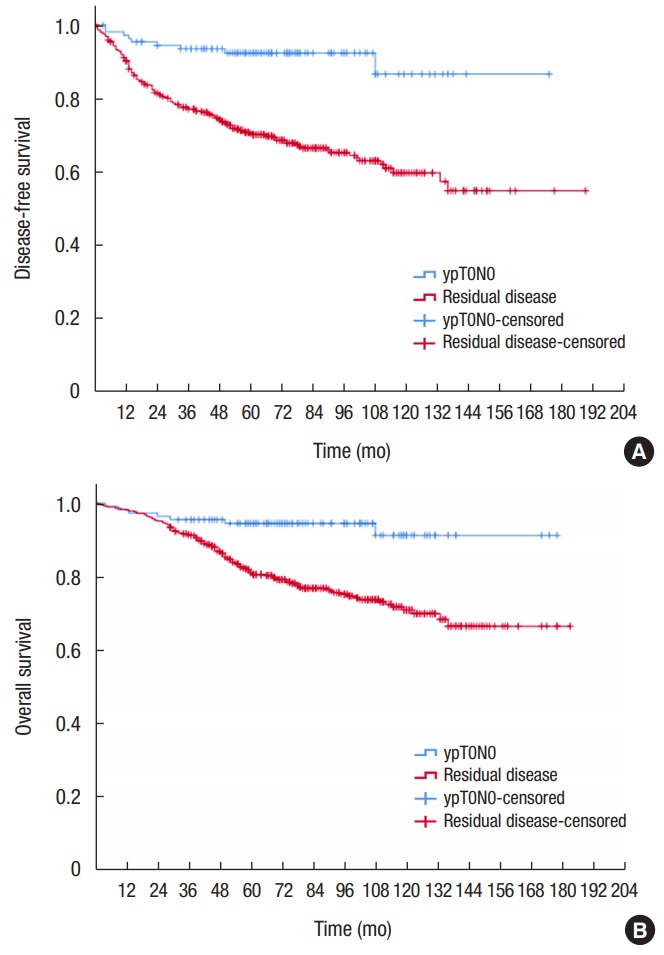
Kaplan-Meier survival curves for disease-free survival (A), and overall survival (B) for patients with complete pathologic response (ypT0N0, blue line) compared to patients with residual disease (red line).

Kaplan-Meier survival curves for disease-free survival (A), and overall survival (B) for patients with complete pathologic response (ypT0N0, blue line) compared to patients with residual disease (red line).