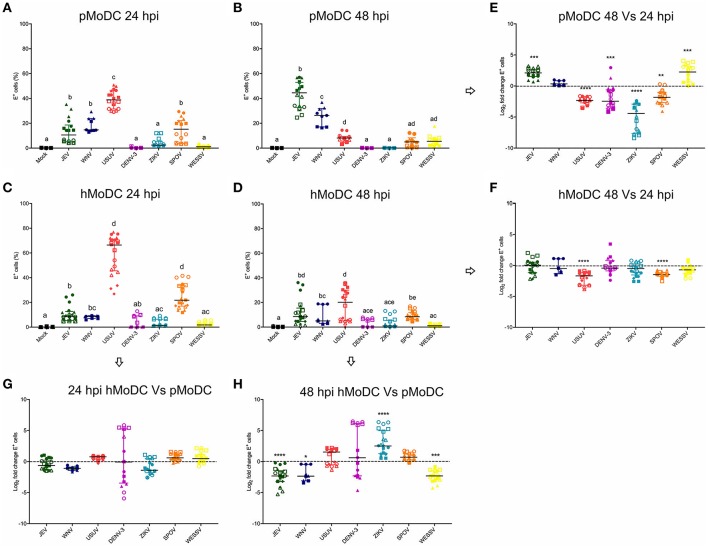
Figure 1.
Comparative susceptibility of pMoDC and hMoDC to selected Flaviviruses. (A–D) E protein expression in pMoDC and hMoDC after infection with different viruses at a MOI of 0.1 TCID50 per cell. E protein expression was quantified after 24 (A,C) and 48 hpi (B,D) by flow cytometry. (G,H) Relative ability of Flaviviruses to infect hMoDC and pMoDC shown as fold change of infection (E protein positive cells) calculated at 24 (G) and 48 (H) hpi. (E,F) Fold change in infected cells between 24 and 48 hpi, shown for pMoDC and hMoDC, respectively. All experiments were performed in triplicates and repeated at least three, and up to seven times with cells from different donors. Each symbol represents a different blood donor. Results are presented as scatter plots showing the mean and all points. The different superscript letters in (A–D) indicate significant differences (p ≤ 0.05) between the different viruses. Fold change infected cells results are expressed in logarithmic scale of base 2; for each infection condition significant differences between the calculated fold change and the reference level (equal to 0, dotted line) are indicated (*p ≤ 0.05; **p ≤ 0.002; ***p ≤ 0.001; ****p ≤ 0.0001).

