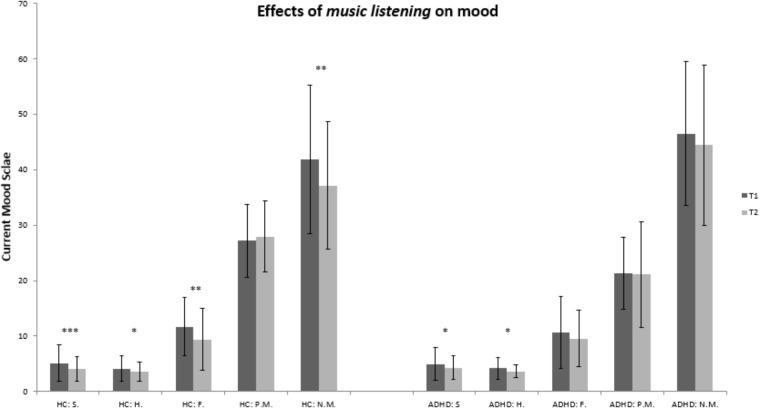
FIGURE 1.
Bar graph for the experimental condition (music): healthy controls vs. ADHD. HC, healthy controls; ADHD, patients with ADHD; T0, prior to being subject to music or silence; T1, after being subject to music or silence. Abbreviations for subscales of the Current Mood Scale: S., sadness; H., hopelessness; F., fatigue; P.M., positive mood; N.M., negative mood; ∗∗∗p < 0.001; ∗∗p < 0.01; ∗p < 0.05.

