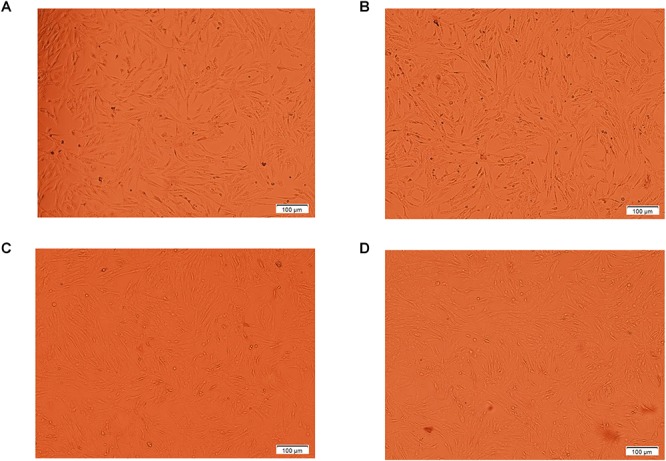
Figure 2.

The morphology of melanocytes treated with different concentrations of tyrosine for 72 h were observed by inverted phase contrast microscope. The A indicates the control melanocytes. The B, C, and D indicate the melanocytes cultured with 10-9, 10-8, and 10-6 mol/L tyrosine, respectively. The number of cells and cytoplasm in the experimental group increased significantly, especially in the 10-9mol/L tyrosine group.
