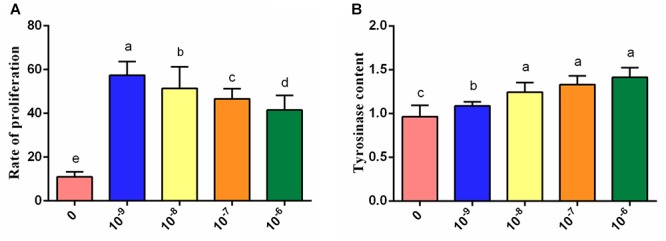
Figure 3.

Effects of treatment with different concentrations of tyrosine for 72 h on melanocytes. (A) Effects of different concentrations of tyrosine on melanocyte proliferation. (B) Effects of different concentrations of tyrosine on the tyrosinase content of melanocytes. Data are expressed as mean ± SD (n = 10). The small letters a, b, etc., on the top of each bar represents statistical significance. Data with different small letters on each bar are statistically significant (P < 0.05), while data with the same letters are not statistically significant (P > 0.05).
