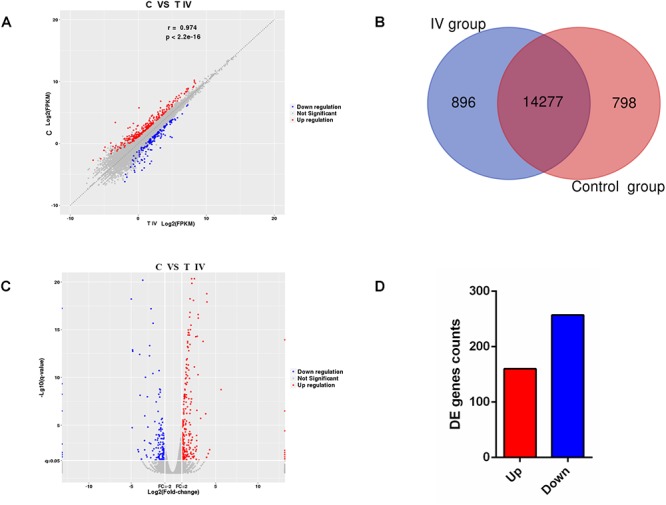
Figure 5.

RNA-seq transcriptome profiles distinguishing the two groups. (A) Correlations of the gene expression levels among the samples. (B) Number of genes identified in breast muscle tissue from chickens in the different groups. (C) Volcano plot of differentially expressed mRNAs between the control group and test group IV. (D) Total number of differentially expressed mRNAs between the control group and test group IV. Red represents gene upregulation, and blue represents gene downregulation.
