Figure 6.

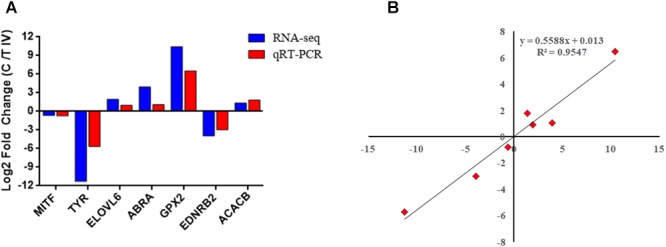
Validation of the RNA-seq data by qRT-PCR. (A) Comparison of the fold change between RNA-seq and qRT-PCR. (B) Pearson correlation scattered plots based on the results of RNA-seq and qRT-PCR.

Validation of the RNA-seq data by qRT-PCR. (A) Comparison of the fold change between RNA-seq and qRT-PCR. (B) Pearson correlation scattered plots based on the results of RNA-seq and qRT-PCR.