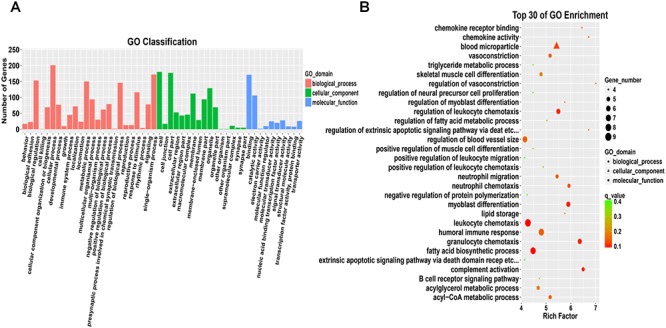
Figure 7.

Gene Ontology analysis of differentially expressed mRNAs. (A) Comparison of GO annotations of functional genes. The horizontal axis shows the secondary nodes of three GO categories. The vertical axis displays the number of annotated differentially expressed genes. (B) Scatter plot of the top 30 enriched GO terms identified from the differentially expressed mRNAs in breast tissue from the control group and test group IV.
