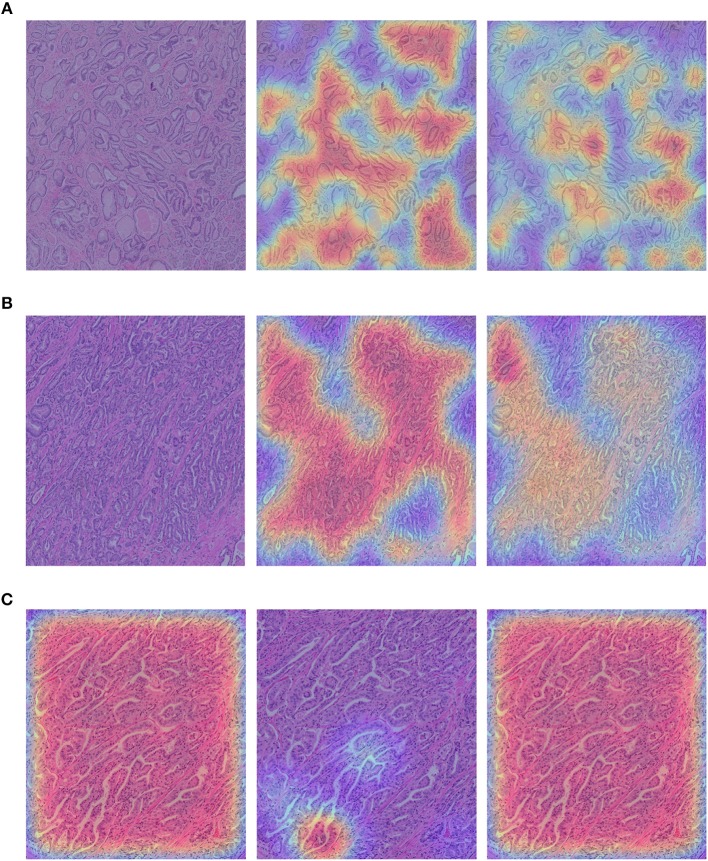
Figure 6.
(A,B) show the example images from RCINJ with Gleason score 6. (C) shows the example image from RCINJ with Gleason score 8. The left column shows the original images with heatmaps overlaid on them; the middle column shows the heatmaps generated from the baseline model (using source domain network); the right column shows the heatmaps generated from the model optimized by .

