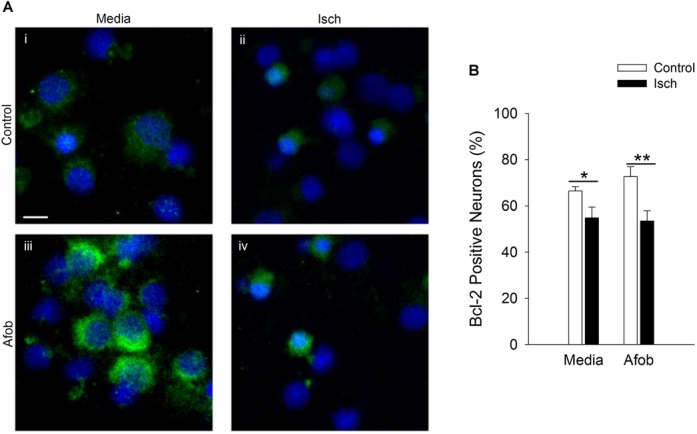
FIGURE 8.

Activation of σ receptors does not upregulate Bcl-2 levels following 24 h ischemia. Neurons were double labeled with DAPI (blue) and anti-Bcl-2 antibody (Alexa Fluor 488 conjugated secondary antibody, green). (A) Photomicrographs of merged images of cultured neurons exposed for 24 h to media alone (i) or media containing 4 mM Azide (ii, Isch), 100 μM afobazole (iii) or 4 mM Azide + 100 μM afobazole (iv). Areas shown are representative regions within larger images used to calculate Bcl-2 expression levels. Scale bar in (i) is 10 μm. (B) Bar graph of mean percent of Bcl-2-positive neurons in experiments in which the cells were exposed to conditions identical to (A) (n = 9). Asterisks indicate significant difference between Control and Isch within Media and Afob, respectively (∗p < 0.05; ∗∗p < 0.01).
