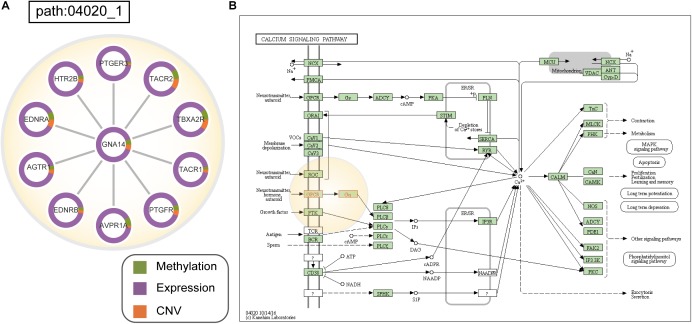
FIGURE 5.
(A) Dysfunctional subpathway (path:04020_1) of calcium signaling pathway in CESC. The vertex in the subnetwork represents a gene, and green and purple colors in the vertex represent the proportion of the gene’s differential expression scores and differential methylation scores between cancer samples and normal samples; orange colors represent the proportion of the influence of CNV on gene expression. (B) Annotation of genes in path:04020_1 to the original calcium signaling pathway in KEGG. Genes are marked with red, and the light-yellow circle corresponds to path:04020_1.

