Figure 1.
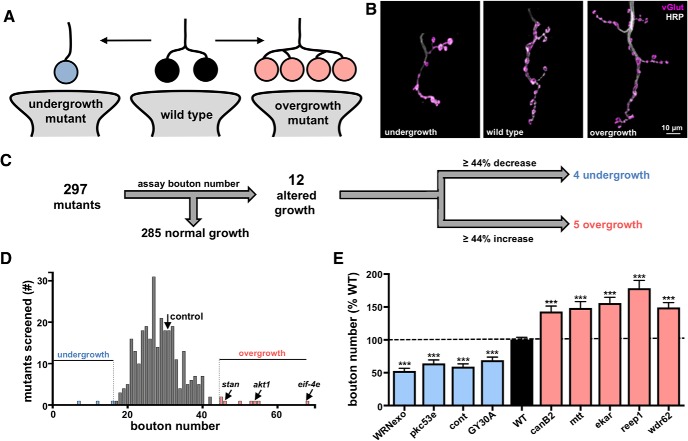
A forward genetic screen identifies synaptic growth mutants at the Drosophila NMJ. A, Schematic illustrating synaptic boutons, numbers of which are a measure of NMJ growth. B, Images of larval muscle 4 NMJs immunostained with anti-HRP (neuronal membrane marker) and anti-vGlut (synaptic vesicle marker). Examples of NMJs in undergrowth and overgrowth mutants are shown. C, Flow diagram of synaptic growth screen strategy and outcome. Mutants with increases or decreases in synaptic growth that were >2 SDs from controls (∼44% increase or decrease) are indicated. D, Histogram of average bouton number per mutant or RNAi line quantified in the synaptic growth screen. Average bouton numbers in control (black arrow), overgrowth mutants (red), and undergrowth mutants (blue) are indicated. Three genes previously reported to exhibit synaptic overgrowth are indicated. E, Bouton numbers of the identified overgrowth and undergrowth mutants shown as a percentage of WT values. No significant differences in bouton numbers were observed between the mutant control (w1118) and RNAi line control (C15xUAS-RFP; Table 1-1) and were pooled. Error bars indicate ± SEM. ***p ≤ 0.001. Additional details of all mutants and RNAi lines screened and statistical information (mean values, SEM, n, p) are shown in Table 1-1 and Table 1-2).

