Figure 8.
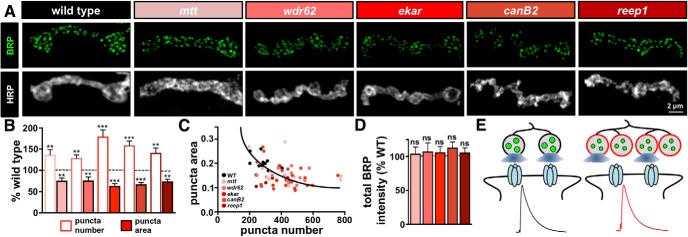
Active zone area is reduced in mutants with enhanced synaptic growth. A, Representative images of individual boutons from WT and the overgrowth mutants immunostained with anti-BRP and anti-HRP. B, Quantification of BRP puncta number and BRP puncta area in the indicated genotypes normalized to WT values. While both bouton and BRP puncta numbers are increased in the overgrowth mutants, a reduction in the average area of each BRP puncta is observed. C, Average BRP puncta area plotted as a function of average BRP puncta number per NMJ in the indicated genotypes demonstrates a homeostatic scaling of average BRP puncta area with total BRP number per NMJ, represented by the curve fitted to the data points (R2 = 0.27). ***p = 0.0006. D, Quantification of total BRP puncta fluorescence intensity per NMJ in the indicated genotypes, suggesting that the total abundance of BRP per NMJ remains unchanged in the overgrowth mutants compared with WT. E, Schematic illustrating increased bouton and BRP puncta numbers in the overgrowth mutants with a reduction in the area of individual BRP puncta. This results in reduced release probability per active zone and per bouton to stabilize NMJ strength. Error bars indicate ± SEM. One-way ANOVA test was performed, followed by a Tukey's multiple-comparison test: **p ≤ 0.01; ***p ≤ 0.001. ns, Not significant (p > 0.05). Detailed statistical information (mean values, SEM, n, p) is shown in Table 4-1.

