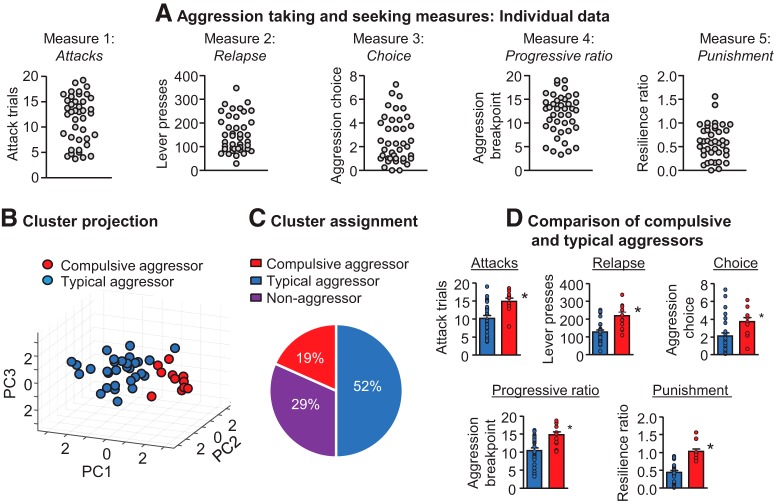
Figure 4.
Cluster analysis of operant aggression-related behaviors reveals that a subset of the population are compulsive aggressors. A, Distributions of individual responses for the five operant aggression measures used for cluster analysis: attacks, relapse, choice, progressive ratio (PR), and punishment. B, Unbiased clustering of operant aggression behavior resulted in two phenotypic clusters: compulsive aggressors and typical aggressors. Shown is a 3D representation of clusters using projection data of the first three principal components of the five measures. C, Pie chart showing phenotypic assignments following cluster analysis. Included are nonaggressors that did not acquire operant aggression. D, Comparison of compulsive and typical aggressor clusters of the measures in A. *Different from the typical aggression group, p < 0.05. PC, Principal component. Data are from Golden et al. (2017a).

