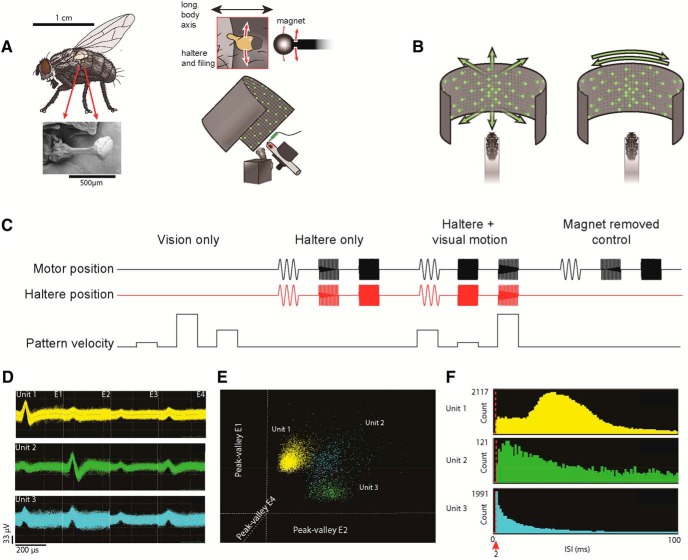
Figure 1.
Experimental setup. A, Depiction of a flesh fly with scanning electron micrograph of a haltere, next to a schematic of the recording setup (right). A servomotor drives a magnet that oscillates the haltere above and below a central resting position and in a plane perpendicular to the longitudinal body axis via an iron filing glued on the bulb (inset). An LED arena is placed in front of the fly and spiking activity is recorded from the brain. B, A star-field pattern was displayed on the LED arena and animated to simulate translational motion (right) and rotational motion in the yaw axis (left). C, Haltere and visual stimuli were presented, varying oscillation frequency and visual speed both independently and simultaneously. Multiple trials of each combination of parameters were presented randomly. After all experimental trials, the magnet was removed from the motor and the stimuli were presented again as a control. D, Overlaid waveforms of all sampled spikes in a recording from all four electrodes (e1–e4) in one tetrode, sorted by waveform properties into three units (yellow, green, and blue). Each column has waveforms recorded from each electrode of the tetrode. E, Unit separation shown by plotting the peak-valley ratio from electrodes 2, 1, and 4 on the x-, y-, and z-axes, respectively. Each point represents one spike. Spikes from the recording that were not clustered into these three units are not shown. F, ISI histograms of the three sorted units. Each unit has <2% of ISIs <2 ms (based on refractory period; red dashed line and red arrow). Unit 1 = 0.2%, unit 2 = 0.1%, unit 3 = 1.7%.

