Figure 4.
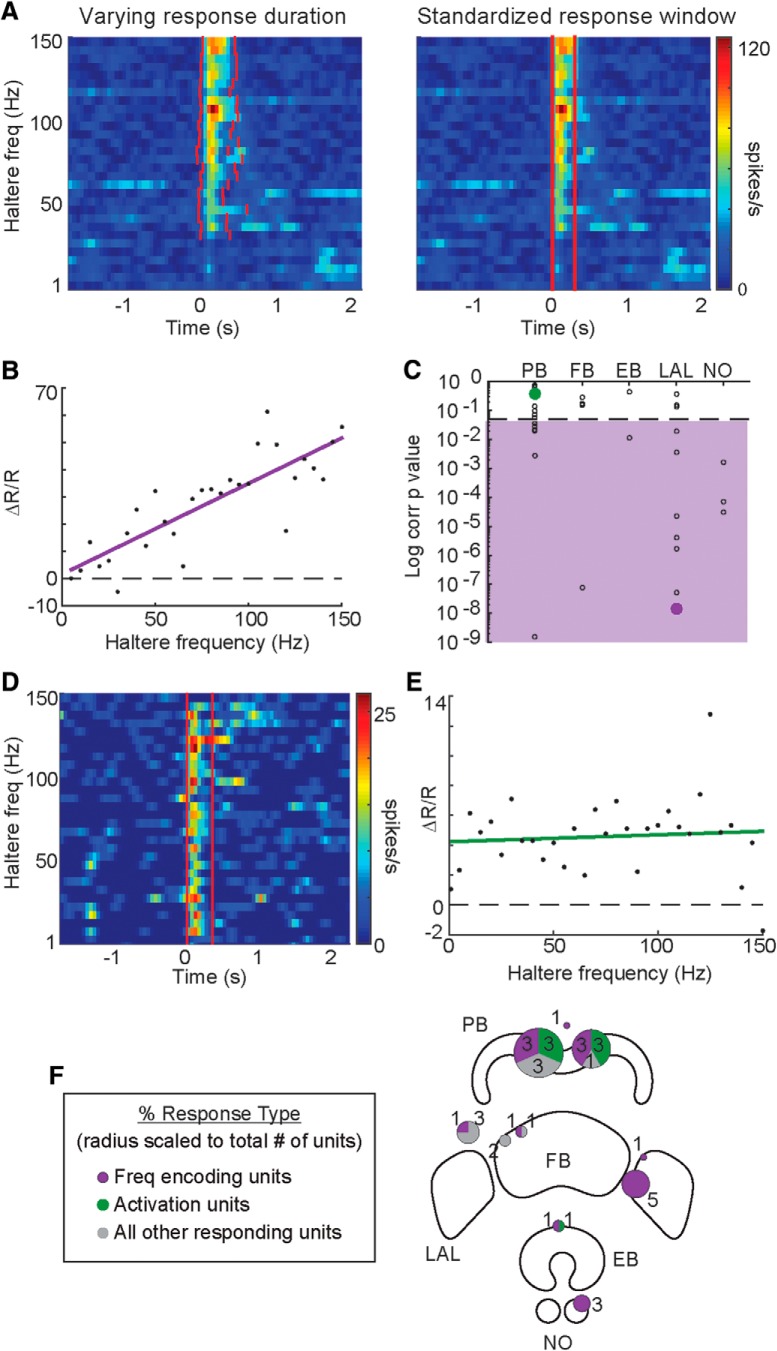
Some CX units signal haltere activation and others encode haltere frequency. A, Unit responses with varying response durations (left) were quantified with a standardized response window (right) based on the median of the mean response durations for all haltere frequencies. B, The normalized response magnitudes, ΔR/R, for this frequency encoding unit are linearly correlated with haltere frequency (p = 1.19e−08). A best-fit line, by least squares, is shown in purple. C, Distribution of significance of correlation (p value on a log scale) for all haltere-responding units, grouped by the substructure the recording site was in or near. Unit p values in the purple region are significantly correlated to haltere frequency (p < 0.05). P values for units shown in B and D are shown by filled purple and green circles, respectively. D, Example of an activation unit. E, Responses in the unit shown in D were not correlated (p = 0.65, green best-fit line) with haltere frequency but were significantly higher than baseline (paired t test, p = 3.1 × 10⁻¹⁰) for >75% of the frequencies tested. F, Schematic of the unit classification locations with proportion of frequency encoding units indicated by purple and activation units indicated by green in a pie chart at recording site. The radius of each pie chart is scaled to the number of responding units found in that recording site (number of units labeled in or next to charts).

