Figure 6.
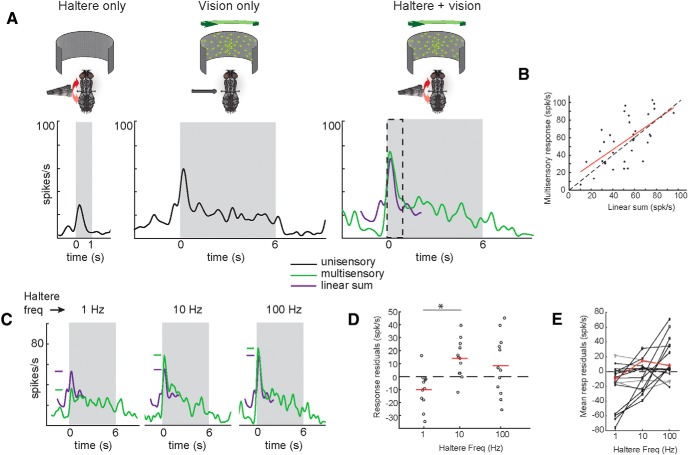
Multisensory responses are both sublinearly and superlinearly summed, depending on haltere frequency. A, A unit response to stimulation of the haltere alone (left), visual motion alone (middle), and both stimuli simultaneously (right, green line). A summation of both unisensory responses is shown in purple (100 Hz haltere oscillations and 70°/s left yaw visual rotation). Gray box indicates time of stimulus presentation. Dashed box indicates response period used for summation comparisons. All y-axes are on the same scale. B, Responses from the unit shown in A to all speed, direction, and haltere frequency combinations of multisensory stimuli versus the corresponding linear sum of unisensory stimuli. Baseline firing rate is subtracted from all responses. Dashed diagonal line indicates linear summation. Red line is a least-squares fit linear model (r = 0.66, slope = 0.85, p = 1.3 × 10⁻⁵). C, Sublinear and superlinear summation depends on haltere frequency. Multisensory and linearly summed unisensory responses of the previous unit for three different haltere frequencies (all for 70°/s left yaw visual rotation). Purple and green dashes indicate peak height of corresponding responses. All y-axes are on the same scale. D, All multisensory response residuals (difference between observed multisensory response and linearly summed unisensory responses) for each visual speed and direction of this unit, separated by haltere frequency. Mean shown in red. Multisensory responses to 1 Hz haltere oscillations show sublinear summation, 10 Hz oscillations produce superlinear summation, and 100 Hz oscillations produce variable results. *p = 0.0053, two-sample t test. E, Mean of residuals across visual speeds at each haltere frequency for all units that respond to both modalities (n = 20 units). Units shown in black showed differences between residuals at each frequency (one-way ANOVA, α = 0.05); units shown in gray did not. Unit depicted in D shown in red.

