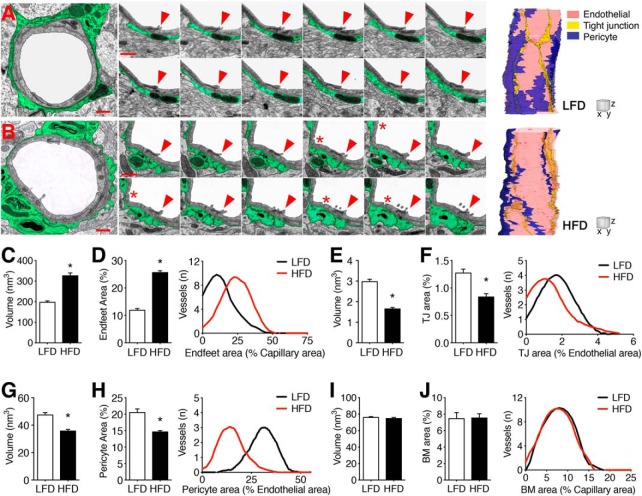
Figure 2.
Three-dimensional ultrastructure of BBB breakdown in mice with diet-induced insulin resistance. A, B, Transmission electron micrographs of representative capillaries from the hippocampal dentate molecular layer of mice on LFD (A) or HFD (B) for 16 weeks. Perivascular astrocyte processes are highlighted in green. Scale bar, 1.0 μm. Cropped images (middle) show serial sections through a single tight junction (red arrow) between two adjacent endothelial cells in mice on LFD (A) or HFD. For serial sections: scale bar, 0.5 μm (z = 0.6 μm). B, Transcytotic vesicles (red asterisks) were frequently observed in capillaries from HFD mice. Far right, 3D reconstructions of representative capillaries from mice on LFD or HFD. For reconstructions: scale cube (XYZ), 1.0 μm. C, Increases in astroglial endfoot process volume in serial images from HFD mice. D, Bar graph shows increases in astroglial endfoot area relative to total capillary area in serial and single-section analysis. Histogram shows data for individual vessels. E, Endothelial tight junctions (TJs) exhibit significant atrophy in HFD mice based on smaller volumes in serial images. F, Bar graph shows reductions in the area of tight junctions relative to endothelial cell areas in serial and single-section analysis. Histogram shows data for individual vessels. G, Pericyte coverage is significantly reduced in HFD mice, based on smaller pericyte volumes in 3D analysis. H, Bar graph shows reductions in the ratio of pericyte area to endothelial cell area in the combined 2D and 3D dataset. Histogram shows data for individual vessels. I, The volume of the endothelial basement membrane (BM) is comparable between LFD and HFD mice. J, The proportional volume of the basement membrane relative to capillary area is unaffected by diet. For graphs in C, E, G, and I, bar height represents the average of three capillaries traced through ∼200 serial sections from (n = 3) mice per diet. For graphs in D, F, H, and J, bar height represents the average of (5–9) vessels from single- and serial-section analysis of (n = 3) mice per diet. For all graphs, error bars represent the SEM and asterisks (*) denote statistical significance at p < 0.05 following t test or Mann–Whitney's U test.

