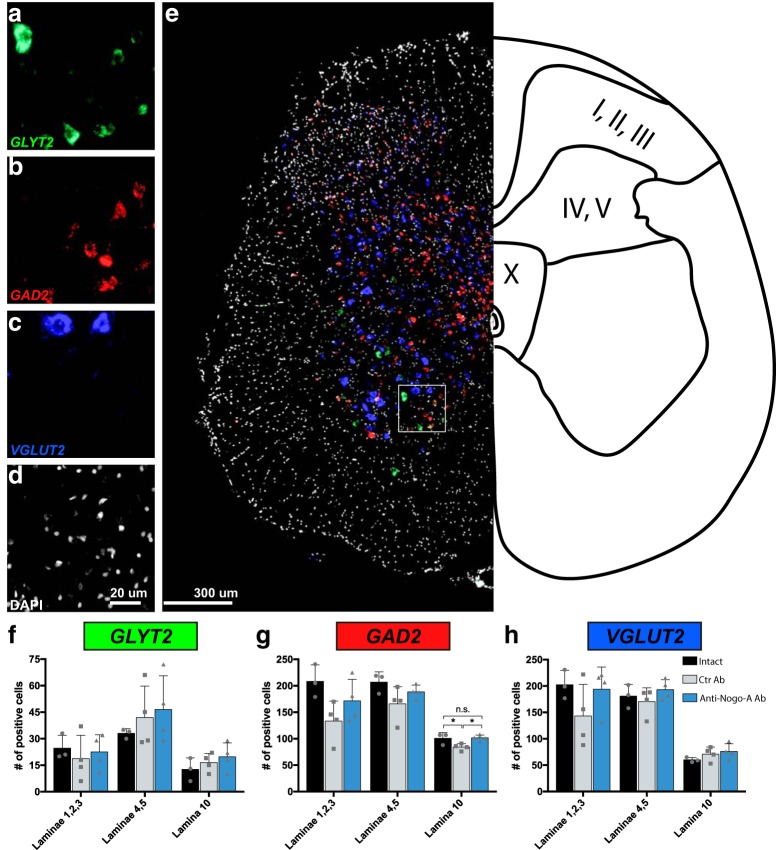
Figure 6.
Glutamatergic, GABAergic, and glycinergic neurons in the sacral cord of intact and spinal cord injured, antibody-treated rats at 28 d after injury. a–e, Representative images of fluorescent in situ hybridization for mRNA of GlyT2 (a), GAD2 (b), and vGlut2 (c). d, Sections were counterstained with DAPI. e, Representative image of the three merged probes, indicating the laminae in the three analyzed regions (I–III; IV, V; X). f–h, Quantification of glycinergic (f), GABAergic (g), and glutamatergic (h) neurons in the sacral cord of intact animals, incomplete spinal cord-injured animals treated with control antibody (Ctr Ab), and incomplete spinal cord-injured animals treated with anti-Nogo-A antibodies (anti-Nogo-A). Data are presented as means ± SD. Scale bars: a–d, 20 μm; e, 300 μm; ns, not significant; *p < 0.05.

