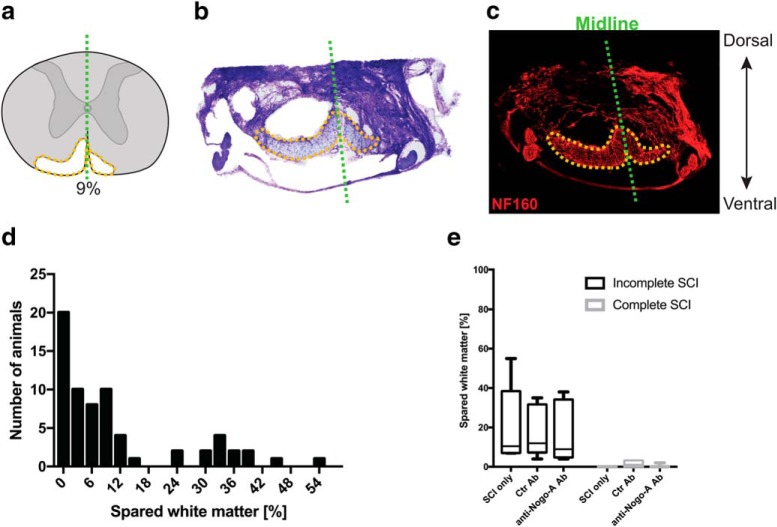
Figure 7.
Spinal cord lesion assessment and distribution among groups. a, Schematic reconstruction of a spinal cord lesion. b, Representative Nissl staining of a spinal cord used to reconstruct the lesion size. c, Neurofilament-160 immunohistological staining shows a high degree of correlation with the Nissl staining. d, Distribution of lesion sizes across the different animals. e, Comparison of the spared white matter between animals with a SCI group and no treatment (SCI only), spinal cord-injured rats treated with control antibody (Ctr Ab), and spinal cord-injured animals treated with anti-Nogo-A antibody (anti-Nogo-A) in case of a complete (black) or incomplete (gray) lesion. Data in e are shown as median and 10–90 percentile.

