Figure 1.
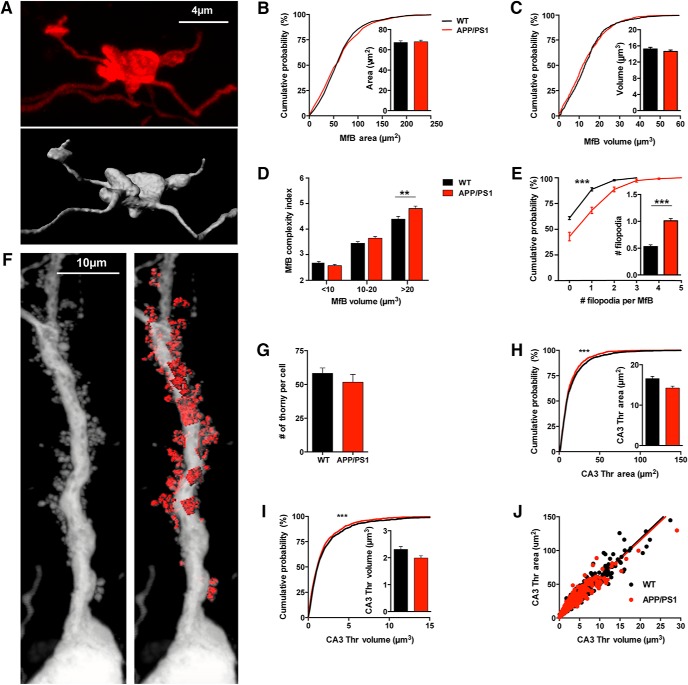
Morphology of the MfBs and postsynaptic thorny excrescences of CA3 PCs in APP/PS1 mice. A, Example image showing a maximum intensity projection of an MfB acquired with confocal microscopy with the representative 3D volumetric reconstruction. B, Cumulative distribution of the area of MfB reconstructed from WT (n = 609, 5 mice) and APP/PS1 mice (n = 868, 6 mice) are not statistically different (KS test, p = 0.1440). Mean values of area are also not significantly different (Mann–Whitney test, p = 0.6624). C, Cumulative distribution of the volume from reconstructed MfBs from WT (n = 609, 5 mice) and APP/PS1 mice (n = 868, 5 mice; KS test, p > 0.999). Mean values of MfB volume are not significantly different (Mann–Whitney test, p = 0.3116). D, Distribution of the complexity index calculated from MfB from WT (n = 609 boutons, 5 mice) and APP/PS1 mice (n = 868 boutons, 5 mice). The distribution of values is significantly different (KS test, p < 0.0001). We analyzed separately the complexity index for three classes of MfBs sizes found in the CA3b region. Smaller MfB have a volume <10 μm3, medium MfBs have a volume ranging from 10 to 20 μm3, and large MfBs have volume values >20 μm3. We found a group difference in the complexity index of APP/PS1 MfB (one-way ANOVA, p < 0.0001). For small MfBs the complexity index is 2.67 ± 0.06 for WT mice (n = 202, 33.2%) and 2.57 ± 0.05 for APP/PS1 mice (n = 337, 37.6%), displaying no significant difference between genotypes (Sidak's multiple-comparisons test, p = 0.6388). Similarly, medium size MfBs are not statistically different between WT (3.44 ± 0.06, n = 266, 43.8%) and APP/PS1 mice (3.65 ± 0.06, n = 331, 36.9%; Sidak's multiple-comparisons test, p = 0.0713). Whereas the mean complexity index of the large MfBs was increased in APP/PS1 mice (4.81 ± 0.09, n = 228, 25%) compared with WT mice (4.39 ± 0.06, n = 140, 25.5%; Sidak's multiple-comparisons test, p = 0.0014). E, Cumulative distribution of the number of filopodia per MfB (APP/PS1 n = 868, 6 mice; WT n = 609, 5 mice; KS test, p < 0.0001) shows an increase for APP/PS1 mice (Mann–Whitney test, p < 0.0001). F, Example image showing a maximum intensity projection of the proximal dendrite of a CA3b pyramidal cell infected by RVΔG-eGFP with the native envelope acquired with confocal microscopy and subsequent reconstruction of ThE in stratum lucidum. G, Average total number of ThE per pyramidal cell; just ThE on apical dendrites were analyzed and only cells with complete apical dendritic arborization were used. The number of ThE is not statistically different between APP/PS1 (n = 8 complete cells, 4 mice) and WT mice (WT n = 9 complete cells, 4 mice; unpaired t test, p = 0.3539). H, Cumulative distribution of the area from reconstructed ThE shows a difference between WT (n = 1259, 4 mice) and APP/PS1 mice (n = 945, 4 mice; KS test, p < 0.0001). But there is no significant difference regarding the mean surface area of reconstructed ThE in the two genotypes (WT n = 1259, 4 mice; APP/PS1, n = 945, 4 mice; Mann–Whitney test, p = 0.1074). I, Cumulative distribution of reconstructed ThE volume shows that there is a small difference in the distribution of ThE between WT (n = 1259, 4 mice) and APP/PS1 mice (n = 945, 4 mice; KS test, p < 0.0001). Nevertheless, the mean volume values in the APP/PS1 mice is not statistically different from those in the WT littermates (Mann–Whitney test, p = 0.1221). J, Summary plot of the relation between surface area and volume of CA3 ThE. There is no difference in the ratio of surface area to volume between the WT (r2 = 0.937) and APP/PS1 mice (r2 = 0.910) because slopes values are very similar (WT slope is 5.72 ± 0.04 and APP/PS1 slope is 5.60 ± 0.057; linear regression, p = 0.0941). All data represented as mean ± SEM. **p < 0.01, ***p < 0.001.

