Figure 2.
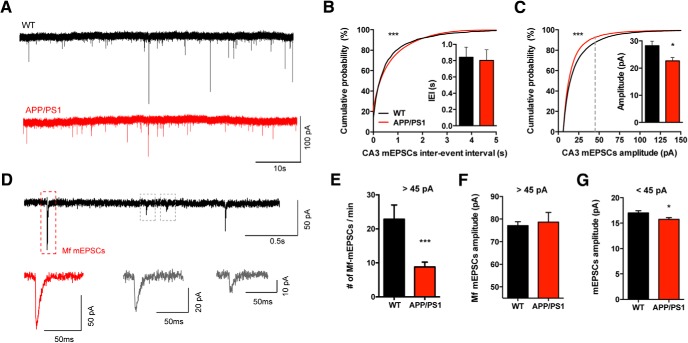
Miniature EPSCs arising from Mf synapses are not altered in APP/PS1 mice. A, Representative recordings of mEPSCs obtained from CA3 PCs from WT and APP/PS1 mice. CA3 PCs were held at −70 mV in the presence of bicuculline (10 μm) and TTX (1 mm). All the events occurred during the 15 min recordings were analyzed and averaged per cell (WT n = 15 cells, 8 mice; APP/PS1 n = 15 cells, 9 mice). B, Cumulative probability analysis of mEPSC IEIs shows a significant difference between WT and APP/PS1 mice (KS test, p < 0.0001) but the average frequency of mEPSCs is not statistically different between WT and APP/PS1 mice (Mann–Whitney test, p = 0.8146). C, Cumulative probability analysis of mEPSCs amplitudes showed a difference between WT and APP/PS1 distributions (KS test, p < 0.0001); the average amplitude of mEPSCs is decreased in APP/PS1 mice (Mann–Whitney test, p = 0.035). Gray dashed line represents the border between Mf-driven events (D–F). D, Example of putative Mf-mEPSC (red framed event): all peaks with amplitudes >45 pA were considered as most likely Mf-driven. E, Number of events with amplitudes >45 pA per minute. On average, APP/PS1 mice show a significant decrease in the number of mEPSCs events larger than 45 pA (Mann–Whitney test, p < 0.0001). F, Average amplitude of mEPSCs larger than 45 pA is not statistically different between genotypes; Mann–Whitney test, p = 0.3627. G, Small mEPSCs events (<45 pA) show a subtle but significant decrease in average amplitude in APP/PS1 mice, unpaired t test, p = 0.0322. All data presented as mean ± SEM. *p < 0.05, ***p < 0.001.

