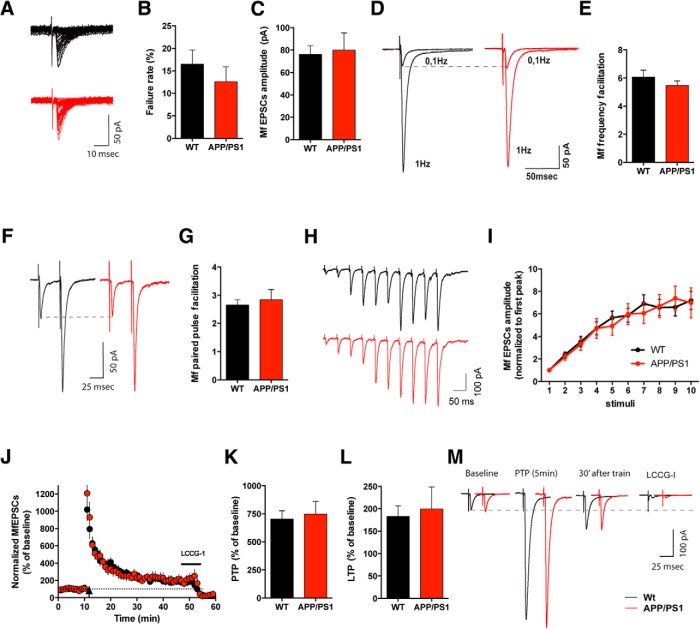
Figure 3.
Presynaptic short-term plasticity and presynaptic LTP are normal at Mf–CA3 synapses of APP/PS1 mice. A, Representative recording from WT and APP/PS1 cell displaying the typical high variability of the Mf-EPSC amplitudes obtained at 0.1 Hz, with several failures. B, Failure rates show no significant difference between WT (n = 15, 10 mice) and APP/PS1 (n = 19, 13 mice) cells, unpaired t test, p = 0.4078. Values are obtained for each genotype by calculating the percentage of failures at 0.1 Hz (events <5 pA were considered as noise). C, Average amplitude of Mf-EPSCs recorded at minimal stimulation conditions is not statistically different between WT (n = 15, 13 mice) and APP/PS1 mice (n = 19, 10 mice; Mann–Whitney test, p = 0.678). D, Representative average traces of the amplitude increase of Mf-EPSCs with FF. EPSCs obtained at 0.1 Hz (30 sweeps) and 1 Hz (30 sweeps) for WT and APP/PS1 mice. E, Similar mean values of FF were observed in WT (n = 18, 15 mice) and APP/PS1 (n = 23, 18 mice; unpaired t test, p = 0.0601). F, Average of 20 sweeps illustrating PPF at an interstimulus interval of 40 ms (inter-sweep interval 20 s) for WT and APP/PS1 Mf synapses. G, Bar graph representing the ratio between the amplitude of the second over the first EPSCs obtained during paired pulse stimulating protocol. APP/PS1 PPF mean values (n = 17, 13 mice) are not statistically different from WT (n = 14, 10 mice; Mann–Whitney test, p = 0.7319). H, Average of 5 traces illustrating 10 stimuli 20 Hz train at the interval of 2 min apart, for WT and APP/PS1 mice. I, Mf EPSC amplitude increases during a 10 stimuli 20 Hz train. Values are normalized to the first peak of the train. No significant differences were observed between WT (n = 14, 8 mice) and APP/PS1 responses (n = 12, 6 mice; two-way ANOVA, p = 0.7745). J, Summary plot of the LTP time course for WT (n = 12, 9 mice) and APP/PS1 cells (n = 11, 8 mice). The LTP protocol (100 pulses at a frequency of 100 Hz repeated three times with a 10 s inter train interval) was applied at the time indicated by the arrow. Mf-EPSCs were averaged every minute and normalized to the mean amplitude of the 10 min period preceding the LTP induction protocol. K, Average values of PTP recorded 5 min after the high-frequency train was applied shows no significant difference between the two genotypes (unpaired t test, p = 0.7373). Values are expressed as percentage of the baseline amplitude of Mf EPSPs. L, Mean amplitude of Mf-EPSCs recorded between 30 and 40 min after LTP induction. There is no significant difference in LTP of APP/PS1 compared with WT littermates (Mann–Whitney test, p = 0.7258). Values are expressed as percentage of the baseline Mf-EPSCs amplitude. M, Traces represent Mf-EPSCs obtained at a stimulus frequency of 0.1 Hz during baseline (10 min), PTP (5 min), LTP (from 30 to 40 min after the train), and LCCG-I (5 min after drug application). All data represented as mean ± SEM.

