Figure 7.
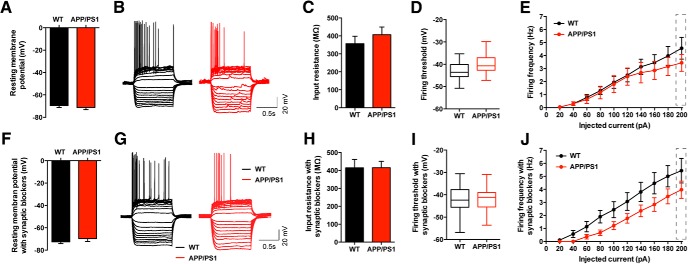
Intrinsic properties of CA3 PCs are not altered in APP/PS1 mice. A, Membrane resting potential measured at the time whole-cell configuration was established. There is no significant difference between WT (n = 13, 4 mice) and APP/PS1 (n = 12, 4 mice; unpaired t test, p = 0.5070). Data represented as mean ± SEM. B, Representative traces of current-clamp recording during 20 pA steps of increasing current injections for WT and APP/PS1 mice. C, There is no significant difference in input resistance of CA3 PC between WT (n = 13, 4 mice) and APP/PS1 (n = 12, 4 mice; unpaired t test, p = 0.4132). Data represented as mean ± SEM. D, Box plot illustrating the similarity in mean firing threshold of CA3 pyramidal neurons between WT (n = 13, 4 mice) and APP/PS1 (n = 12, 4 mice; unpaired t test, p = 0.1005; whiskers are minimum and maximum values, box represents 25th and 75th percentiles, and middle bar represents mean value). E, Firing frequency value during increasing current injections; two-way ANOVA, p = 0.5894 between WT (n = 13, 4 mice) and APP/PS1 (n = 12, 4 mice) revealed no significant difference at any current step. Firing frequency is not statistically different when looking exclusively at the last current step (200 pA; Mann–Whitney test, p = 0.4595). Data represented as mean ± SEM. F–J, The same experiments as in A–E but with the presence of NBQX (20 μm), bicuculline (10 μm), CGP 55845 (3 μm), and d-AP5 (50 μm). F, Bar graph summarizing the lack of significant difference between WT (−72.60 ± 1.57 mV; n = 10, 4 mice) and APP/PS1 (−69.64 ± 2.60 mV, n = 11, 4 mice) CA3 PC resting membrane potential (Mann–Whitney test, p = 0.4311). Data represented as mean ± SEM. H, Absence of significant difference in the input resistance of CA3 PC between WT (414.70 ± 47.19 MΩ; n = 10, 4 mice) and APP/PS1 (415.10 ± 35.97 MΩ; n = 12, 4 mice; unpaired t test, p = 0.9949). Data represented as mean ± SEM. I, Box plot illustrating the similarity in mean firing threshold of CA3 pyramidal neurons between WT (−42.26 ± 2.27 mV; n = 10, 4 mice) and APP/PS1 (−41.42 ± 1.75 mV; n = 11, 4 mice; unpaired t test, p = 0.7722; whiskers are min and max values, box represents 25th and 75th percentiles, and middle bar represents mean value). J, Firing frequency during increasing current injections. Two-way ANOVA (p = 0.0868) shows no significant difference between WT and APP/PS1 cells at any of the steps; firing frequencies recorded at the 200 pA current step are not statistically different in WT (5.43 ± 0.95 Hz; n = 10, 4 mice) and APP/PS1 (3.97 ± 0.66; n = 11, 4 mice) when analyzed separately with (unpaired t test, p = 0.2120). Data represented as mean ± SEM.

