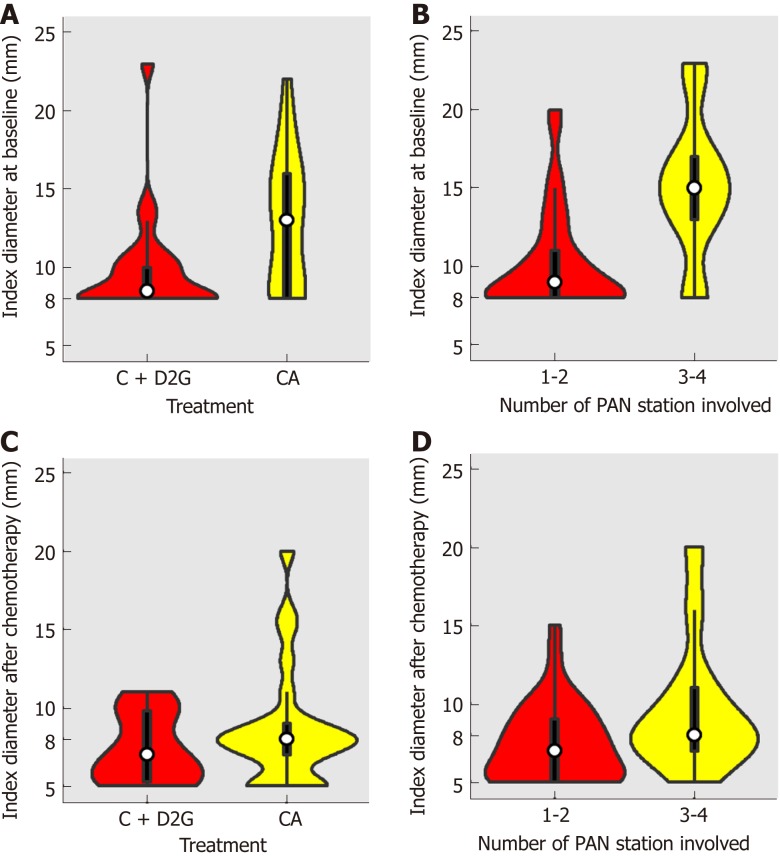
Figure 2.
Violin plots of index diameter distribution of all patients. A: Violin plots of index diameter distribution at baseline of patients who underwent D2 resection or not; B: Violin plots of index diameter distribution at baseline of patients with involvement of more than two para-aortic lymph node stations or not; C: Violin plots of index diameter distribution of patients who underwent D2 resection or not after initial chemotherapy; D: Violin plots of index diameter distribution after initial chemotherapy of patients with involvement of more than two para-aortic lymph node stations or not. CA: Chemotherapy alone; C+D2G: Chemotherapy plus D2 gastrectomy; PAN: Para-aortic lymph node.

