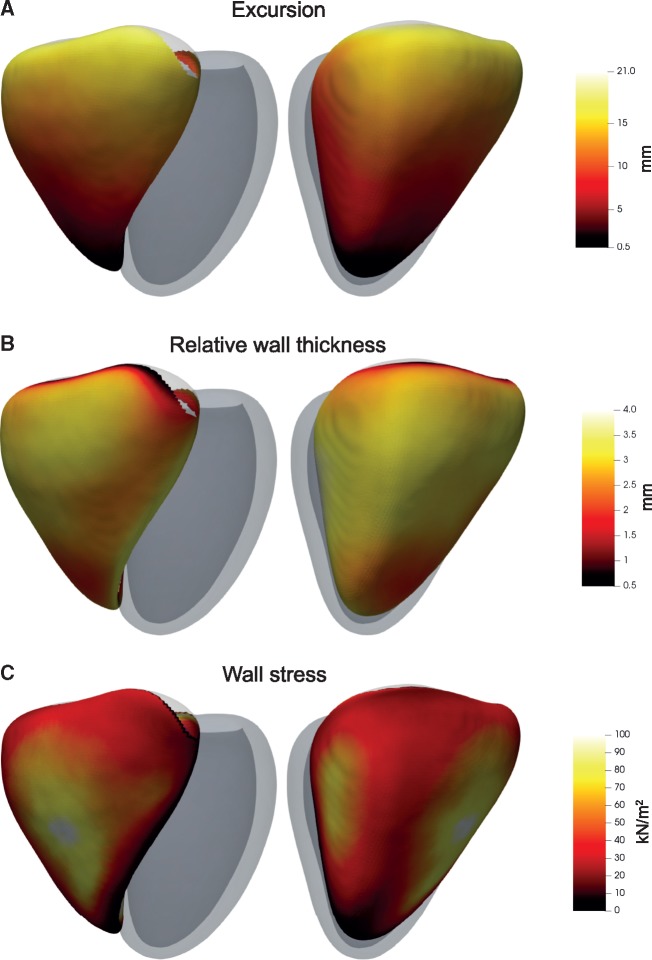
Figure 2.
Three-dimensional models of the right ventricle in PH patients. Co-registered phenotypic data were used to create a map of RV features across the population. The RV is shown from two viewpoints with the left ventricle represented in grey. The median (A) systolic excursion, (B) relative wall thickness, and (C) wall stress at each corresponding anatomical point throughout the population (n = 312) is shown. These phenotypic data were then used in 3D regression models with haemodynamic variables or metabolomics levels as explanatory variables.

