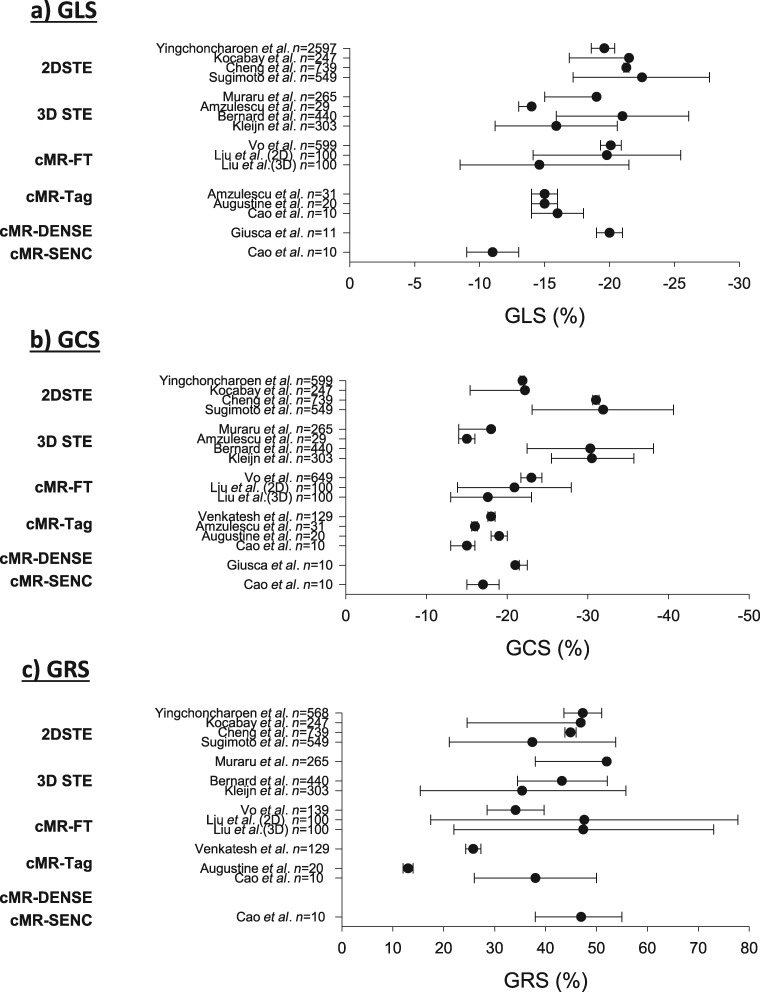
Figure 8.
Reported normal (mean and 95% confidence interval) global strain values in healthy subjects for different imaging modalities. Data from refs.45,65,68,82–91 Normal GLS, GCS, and GRS values were compared using random effects models weighted by inverse variance and heterogeneity between methods was compared using the Cochran Q test and the inconsistency factor. For all strain measurements, I2 and Q indicated significant heterogeneity among studies and methods.

