
Figure 1.
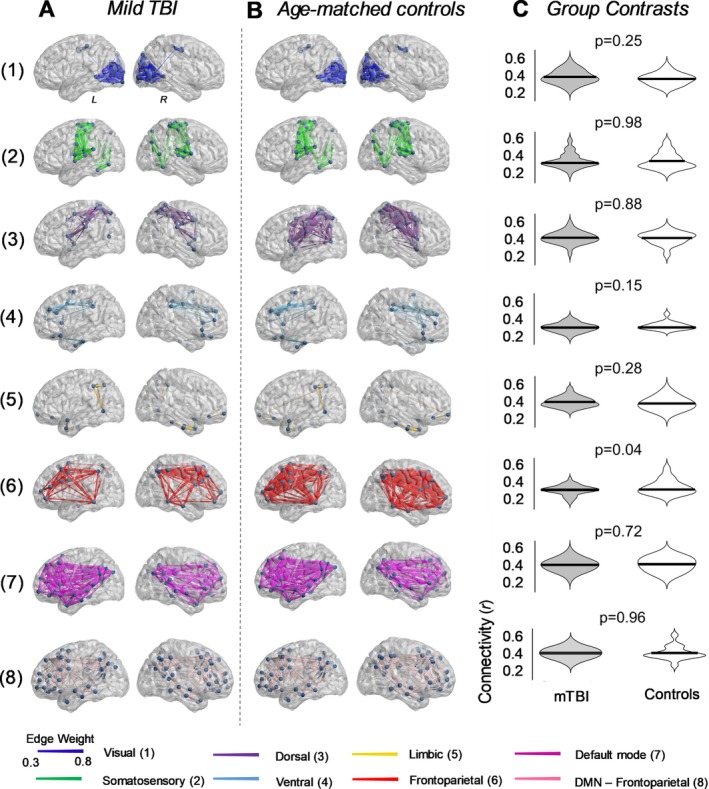
Comparison of resting‐state functional connectivity in children with mild TBI. Resting‐state functional connectivity was calculated in seven validated resting‐state brain networks,19 as well as between the frontoparietal and default mode networks. (A) Anatomical representation of the seven functional networks, segregated according to group. Patterns of connectivity between the frontoparietal and default mode networks are also depicted (row 8). Edge diameter indicates group‐averaged functional connectivity strength (Pearson correlation). (B) Distribution of functional connectivity strength between mTBI and healthy controls. Functional connectivity did not significantly differ between the two groups (two‐tailed unpaired t‐test; FDR corrected).