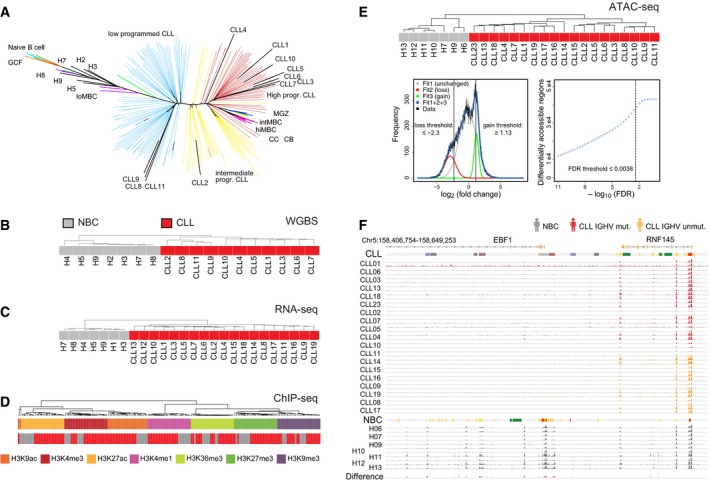
Figure EV1. Data set overview.

- Assignment of CLL samples to B‐cell developmental stages based on DNA methylation patterns.
- Unsupervised hierarchical clustering of the samples from Pearson's correlation coefficient (average linkage) for DNA methylation from WGBS. The analysis was carried out considering the most variable 1 million CpG sites.
- Same as panel (B) but computed from the gene expression profiles of 2,000 genes from RNA‐seq.
- Same as panel (B) but computed for histone modifications at promoters from ChIP‐seq. Samples cluster according to the modifications, underlining specificity of the experimental data, and separate inactive (H3K9me3 and H3K27me3) from the other active histone marks.
- Top: Unsupervised hierarchical clustering of the samples from Spearman's correlation coefficient (average linkage) for chromatin accessibility from ATAC‐seq calculated from ˜ 120,000 accessible regions. Bottom: Distribution of fold changes in ATAC‐seq signal from DiffBind between CLL and NBC samples. The data were fitted to a sum of three Gaussian functions. Threshold values were determined from the indicated cross‐over points as described in Materials and Methods.
- Exemplary comparison of ATAC‐seq data of all analyzed CLL IGHV mutated (n = 11), CLL IGHV unmutated (n = 8), and NBC (n = 7) samples in replicates (except for H10, H12, and H13) at the EBF1 locus. It contains regions with lost ATAC‐seq signal in CLL as compared to NBC controls determined by the DiffBind analysis (red bars in bottom track “Difference”). Representative ChromHMM state annotations of CLL1 and H6 are depicted as color bars above the corresponding group.
