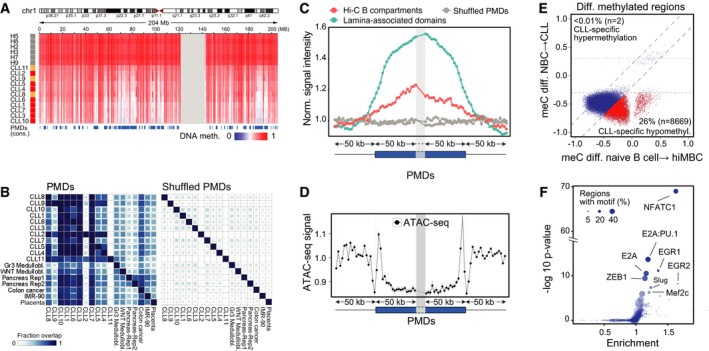
Figure EV2. Characterization of partially methylated domains and DMRs.

- Example of a large PMD on chromosome 1 derived from a consensus of CLL samples (n = 11) in comparison with the NBC reference (n = 6).
- Similarity of PMDs found in CLL, medulloblastoma (Group3/WNT; Hovestadt et al, 2014), colon cancer (Berman et al, 2011), pancreas (Schultz et al, 2015), and placenta tissues (Schroeder et al, 2013). Medullobl., medulloblastoma; Gr3, group3; Rep, replicate. Lower triangular part refers to the fraction of the PMD on the y‐axis overlapping with the PMD sample on the x‐axis and vice versa for the upper triangular.
- Distribution of ATAC around the ± 50 kb flanking regions of PMD boundaries in 5‐kb windows. Normalized fold changes were calculated by dividing to the average signal flanking outside the PMD boundaries. Blue box, within PMDs; thin line, outside PMDs, nor.—normalized.
- Methylation changes in DMRs from CLL vs. NBCs plotted against the methylation changes of the same regions during normal B‐cell maturation from naive B cells to class‐switched memory B cells (hiMBC). Data for DMRs were averaged across multiple CpG sites and across replicate samples for each experimental class. CLL‐specific DMRs (red, CLL‐specific) displayed a higher change of more than 0.2 b‐value in comparison with B‐cell programming. The parameter n indicates the total number of CLL‐specific DMRs, hypo‐ and hyper‐methylated.
- Enrichment of TF binding motifs at ATAC‐seq peaks overlapping with DMRs. As background, all the consensus ATAC‐seq peaks outside the DMRs were used. Size indicates the percentage of DMR‐overlapping ATAC‐seq peaks with the motif.
