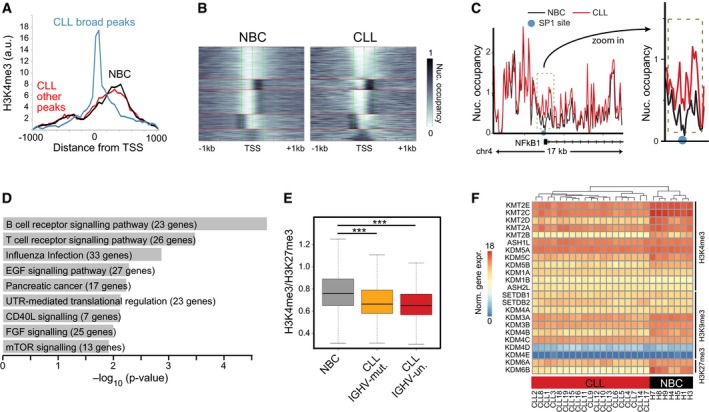
H3K4me3 distribution around TSS for NBCs and CLL. Both samples types displayed a similar H3K4me3 distribution up‐ and downstream of the TSS. However, for CLL extended peaks were found that centered around the TSS, indicating a gain of nucleosomes in these regions.
Cluster plot of nucleosomes occupancy at all CLL‐specific promoters that gain nucleosomes in CLL. Left: K‐means clustering of nucleosome occupancy for NBC samples. Right: CLL samples with the same ordering as for NBC controls. A fraction of promoters in the bottom cluster displayed a particularly pronounced gain of nucleosomes at the TSS, which reflects the profile of the promoters with the extended H3K4me3 signal depicted in panel (A).
Nucleosome profile at the promoter region of NFKB1 with higher nucleosome density for CLL at the TSS (red line) compared to NBCs (black line). The light blue circle indicates SP1 binding sites in the lymphoblastoid cell line GM12878.
GO enrichment analysis of genes with gained nucleosomes at their promoters.
Ratio of read counts for H3K4me3 and H3K27me3 at bivalent promoters for CLL samples grouped according to their IGVH mutation status and compared to NBC samples (***P < 0.001, t‐test).
Cluster heatmap of histone demethylase and methyltransferase expression values. Samples were clustered according to expression similarities (hierarchical clustering), while enzymes were sorted according to their target modification.

